

Dell stock tests $609.59 resistance after Nvidia integration boosts AI capabilities

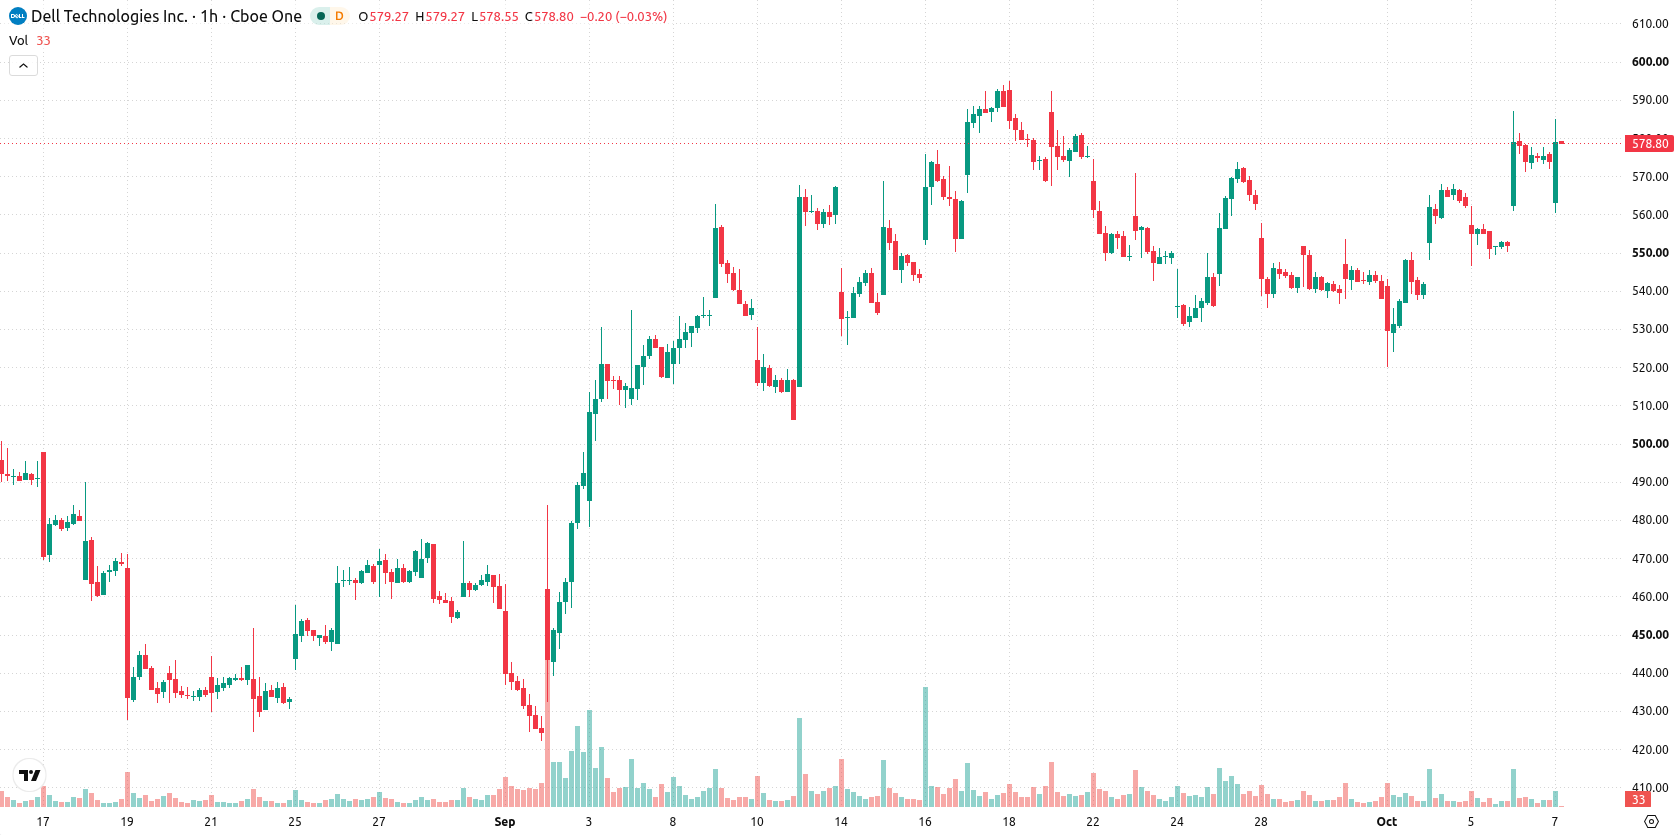
Dell (DELL) stock is trading at $579.98, climbing 1.04% on the day. The price sits above its key moving averages, highlighting strong momentum relative to short- and medium-term trends.
 439.45
506.98
Highlights
- Dell reported $60.9 billion in AI server orders, $16.4 billion in revenue, and a $95 billion backlog, supporting strong near-term fundamentals.
- The company expanded its AI Data Platform with new knowledge graph capabilities and improved Nvidia integration, targeting enterprise adoption.
- Shares of Dell trade in a sustained bullish structure with most indicators confirming buyer dominance and a four-day expected range of $550.37 to $609.59.
AI server demand and new features drive financial upside
Dell's latest quarterly results revealed an exceptional performance in its AI server segment, reporting $60.9 billion in orders, $16.4 billion in revenue, and a backlog of $95 billion, according to MarketBeat. This magnitude of realized business demonstrates robust customer demand for advanced AI infrastructure and strengthens Dell’s near-term financial position. Complementing this, the company launched updates to its AI Data Platform, introducing new knowledge graph features and enhanced Nvidia processing to further increase enterprise adoption. Dell also released critical security patches for its System Update tool, addressing vulnerabilities and protecting its broad enterprise customer base.
Buyer dominance persists as momentum signals caution
DELL trades above its MA-20 and MA-50 on the working timeframe, with the MA-200 well below the current price at $297. Support is established at the Ichimoku Kijun level of $562.04. Intraday momentum indicators show a Buy signal from MACD, with a Neutral ADX reading, while RSI at 65.34 and CCI both signal buying conditions. Stoch RSI readings are in overbought territory, and Bull/Bear Power strongly favors buyers, although the Awesome Oscillator remains neutral. These technical factors highlight moderate but sustained trend strength and persistent intraday buyer dominance, but caution is warranted due to stretched momentum indicators.
High upside potential as price eyes breakout range
In the short term, DELL is expected to trade within a range of $550.37 to $609.59 over the next four trading days. The likelihood of an upward move is very high, while downside risk is viewed as low. In the base case scenario, price action consolidates within this band, with a potential rally if price breaks above $609.59. A bearish sequence would require a break below immediate support near $550.37, which could open the door to further downside.
Previously it was reported that Dell’s expansion into Japan’s AI data center market underscored its strong positioning within the broader AI infrastructure sector. The current analysis adds further conviction to this outlook, with Dell’s exceptional AI server order flow and resilient technical structure reinforcing $609.59 as the key upside level to monitor for a potential breakout.










-
 Afghanistan
-
 Albania
-
 Algeria
-
 Angola
-
 Argentina
-
 Armenia
-
 Australia
-
 Austria
-
 Azerbaijan
-
 Bahamas
-
 Bahrain
-
 Bangladesh
-
 Belarus
-
 Belgium
-
 Bolivia
-
 Botswana
-
 Brazil
-
 Brunei
-
 Bulgaria
-
 Cambodia
-
 Cameroon
-
 Canada
-
 Chile
-
 China
-
 Colombia
-
 Congo
-
 Costa Rica
-
 Cote d'Ivoire
-
 Croatia
-
 Cuba
-
 Cyprus
-
 Czechia
-
 DR Congo
-
 Denmark
-
 Dominican Republic
-
 Ecuador
-
 Egypt
-
 El Salvador
-
 Estonia
-
 Eswatini
-
 Ethiopia
-
 Finland
-
 France
-
 Georgia
-
 Germany
-
 Ghana
-
 Greece
-
 Haiti
-
 Hong Kong
-
 Hungary
-
 India
-
 Indonesia
-
 Iran, Islamic republic
-
 Iraq
-
 Ireland
-
 Israel
-
 Italy
-
 Jamaica
-
 Japan
-
 Jordan
-
 Kazakhstan
-
 Kenya
-
 Korea
-
 Kuwait
-
 Kyrgyzstan
-
 Laos
-
 Latvia
-
 Lebanon
-
 Lesotho
-
 Libya
-
 Lithuania
-
 Luxembourg
-
 Madagascar
-
 Malaysia
-
 Malta
-
 Mauritius
-
 Mexico
-
 Moldova
-
 Mongolia
-
 Montenegro
-
 Morocco
-
 Mozambique
-
 Myanmar
-
 Namibia
-
 Nepal
-
 Netherlands
-
 New Zealand
-
 Nigeria
-
 North Macedonia
-
 Norway
-
 Oman
-
 Pakistan
-
 Palestine
-
 Panama
-
 Papua New Guinea
-
 Paraguay
-
 Peru
-
 Philippines
-
 Poland
-
 Portugal
-
 Puerto Rico
-
 Qatar
-
 Reunion
-
 Romania
-
 Rwanda
-
 Saudi Arabia
-
 Serbia
-
 Singapore
-
 Slovakia
-
 Slovenia
-
 Somalia
-
 South Africa
-
 Spain
-
 Sri Lanka
-
 Sweden
-
 Switzerland
-
 Syria
-
 Taiwan
-
 Tajikistan
-
 Tanzania
-
 Thailand
-
 Trinidad and Tobago
-
 Tunisia
-
 Turkey
-
 UAE
-
 Uganda
-
 Ukraine
-
 United Kingdom
-
United States
-
 Uruguay
-
 Uzbekistan
-
 Venezuela
-
 Vietnam
-
 Yemen
-
 Zambia
-
 Zimbabwe
- Forex
- Crypto












