

RIOT slides nearly 5% as oversold technicals and lack of new news fuel decline

Riot Platforms, Inc. (RIOT) slumped 4.94% as persistent selling pressure and a lack of fresh fundamental catalysts dominated trading. Technical structure supports the move, with RIOT trading below key moving averages and immediate support levels in focus.
 12.87
14.44
Highlights
- Riot Platforms stock trades below key moving averages, indicating persistent pressure from sellers across timeframes.
- Momentum and oscillators show oversold conditions and weak trend strength, confirming active seller control intraday.
- Shares recently traded at $17.99 with support at $16.85, resistance at $18.77, and a 75% probability of downside within a $16.85 to $19.13 range over five days.
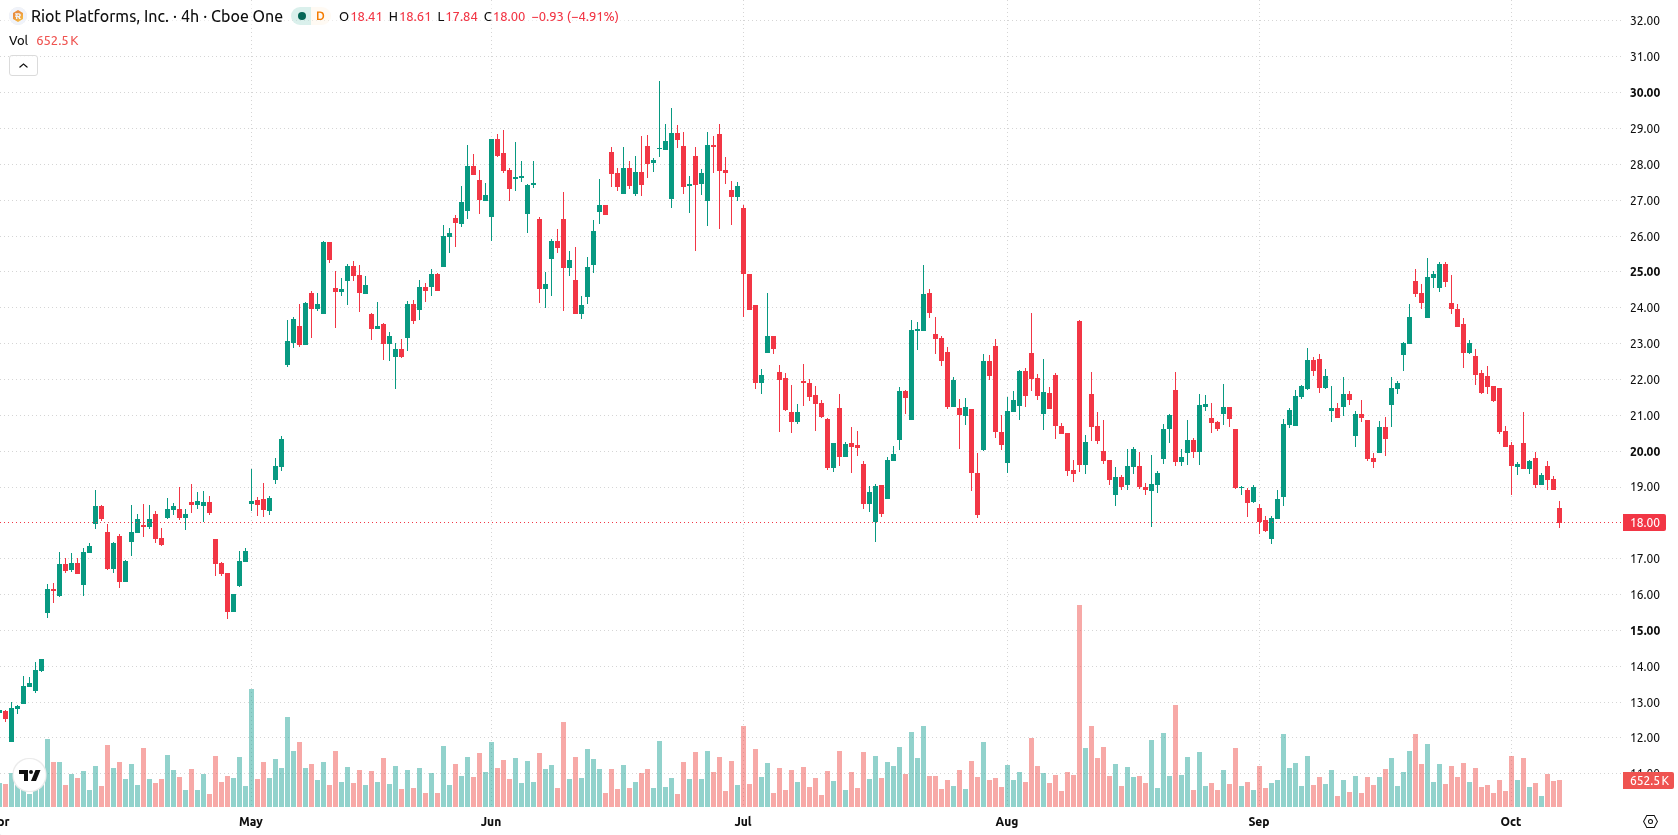
Bearish pressure builds as momentum indicators confirm seller dominance
RIOT remains below its 20-day ($21.61), 50-day ($20.79), and 200-day ($19.4) moving averages, emphasizing pronounced bearish pressure across short, medium, and long timeframes. Key resistance is identified at $18.77, while nearest support stands at $16.85. Despite the prevailing weakness, the ongoing alignment of the 50-day and 200-day moving averages still points to underlying bullish potential for a longer-term recovery. Momentum indicators reflect caution, as the MACD registers at -0.66 (neutral) and the ADX at 11.29 (neutral), both indicating a lack of directional conviction. The RSI at 39.01, Stochastic RSI at 0, and CCI at -114.96 confirm oversold conditions, with the Bull/Bear Power at -1.08 highlighting intraday seller dominance. The Awesome Oscillator at -1.2 echoes the ongoing downside bias. Intraday volatility remains elevated at 4.29%, and oscillators consistently signal downside momentum.
Earlier, analysts noted that Riot Platforms was experiencing sustained bearish momentum and technical weakness. The current analysis strengthens this view, emphasizing that persistent downside signals and oversold conditions make the $16.85 support level crucial to monitor for potential renewed declines.









-
 Afghanistan
-
 Albania
-
 Algeria
-
 Angola
-
 Argentina
-
 Armenia
-
 Australia
-
 Austria
-
 Azerbaijan
-
 Bahamas
-
 Bahrain
-
 Bangladesh
-
 Belarus
-
 Belgium
-
 Bolivia
-
 Botswana
-
 Brazil
-
 Brunei
-
 Bulgaria
-
 Cambodia
-
 Cameroon
-
 Canada
-
 Chile
-
 China
-
 Colombia
-
 Congo
-
 Costa Rica
-
 Cote d'Ivoire
-
 Croatia
-
 Cuba
-
 Cyprus
-
 Czechia
-
 DR Congo
-
 Denmark
-
 Dominican Republic
-
 Ecuador
-
 Egypt
-
 El Salvador
-
 Estonia
-
 Eswatini
-
 Ethiopia
-
 Finland
-
 France
-
 Georgia
-
 Germany
-
 Ghana
-
 Greece
-
 Haiti
-
 Hong Kong
-
 Hungary
-
 India
-
 Indonesia
-
 Iran, Islamic republic
-
 Iraq
-
 Ireland
-
 Israel
-
 Italy
-
 Jamaica
-
 Japan
-
 Jordan
-
 Kazakhstan
-
 Kenya
-
 Korea
-
 Kuwait
-
 Kyrgyzstan
-
 Laos
-
 Latvia
-
 Lebanon
-
 Lesotho
-
 Libya
-
 Lithuania
-
 Luxembourg
-
 Madagascar
-
 Malaysia
-
 Malta
-
 Mauritius
-
 Mexico
-
 Moldova
-
 Mongolia
-
 Montenegro
-
 Morocco
-
 Mozambique
-
 Myanmar
-
 Namibia
-
 Nepal
-
 Netherlands
-
 New Zealand
-
 Nigeria
-
 North Macedonia
-
 Norway
-
 Oman
-
 Pakistan
-
 Palestine
-
 Panama
-
 Papua New Guinea
-
 Paraguay
-
 Peru
-
 Philippines
-
 Poland
-
 Portugal
-
 Puerto Rico
-
 Qatar
-
 Reunion
-
 Romania
-
 Rwanda
-
 Saudi Arabia
-
 Serbia
-
 Singapore
-
 Slovakia
-
 Slovenia
-
 Somalia
-
 South Africa
-
 Spain
-
 Sri Lanka
-
 Sweden
-
 Switzerland
-
 Syria
-
 Taiwan
-
 Tajikistan
-
 Tanzania
-
 Thailand
-
 Trinidad and Tobago
-
 Tunisia
-
 Turkey
-
 UAE
-
 Uganda
-
 Ukraine
-
 United Kingdom
-
United States
-
 Uruguay
-
 Uzbekistan
-
 Venezuela
-
 Vietnam
-
 Yemen
-
 Zambia
-
 Zimbabwe
- Forex
- Crypto












