

Home Depot stock forecast: Recovery attempt continues after outlook update

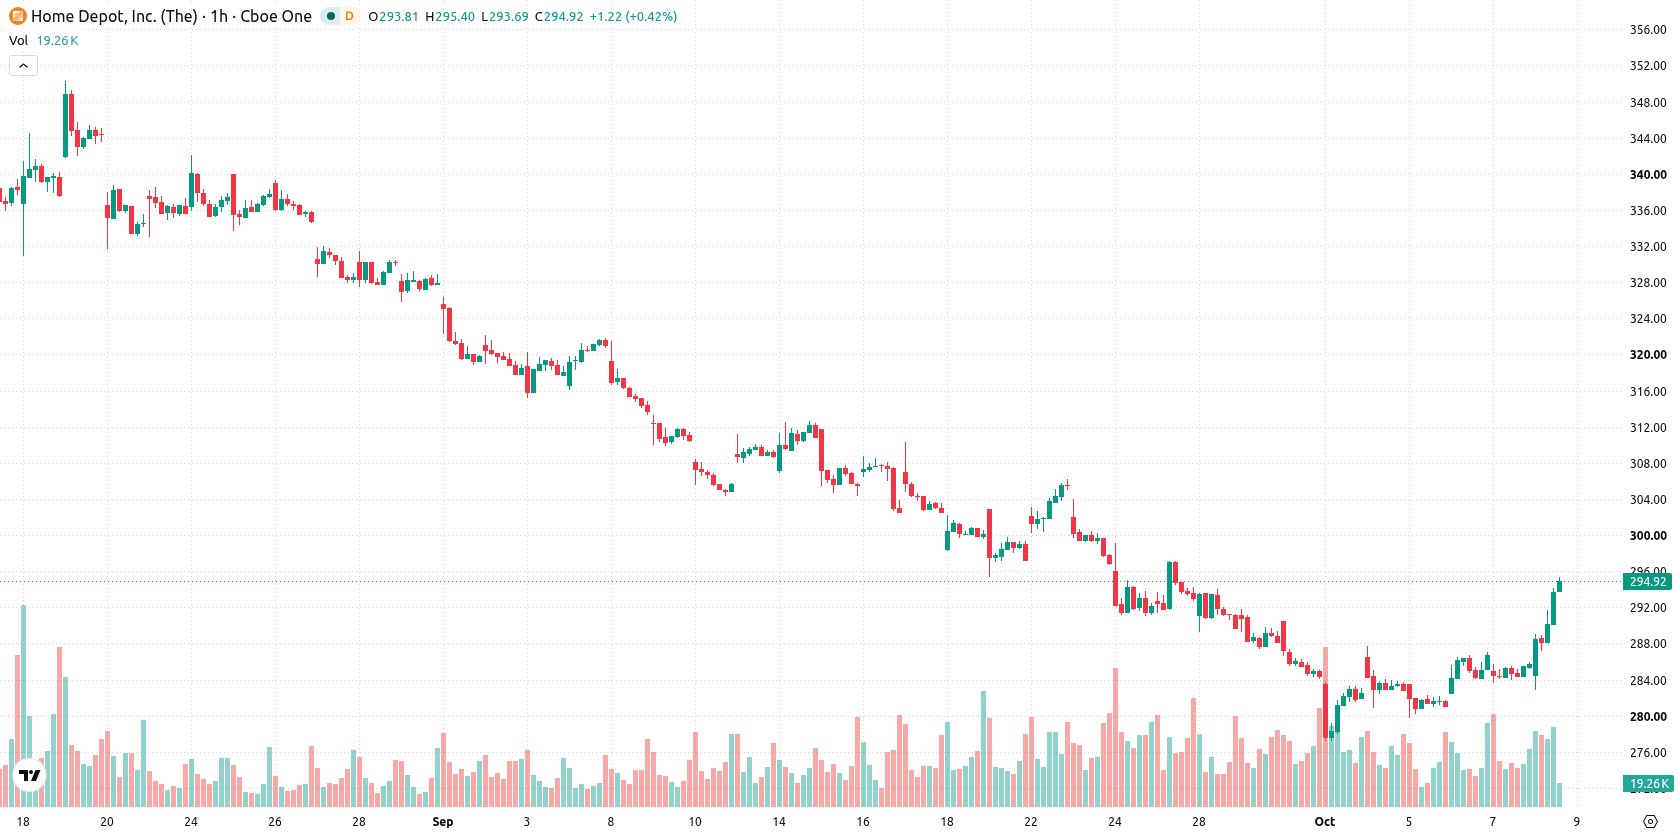
Home Depot (HD) stock is trading at $294.76, up 3.16% on the day and sitting close to today’s high, with moderate intraday volatility. The current price remains above its short- and medium-term moving averages, reflecting near-term strength.
 340.55
355.35
Highlights
- Home Depot reaffirmed its fiscal 2026 outlook, maintaining long-term targets despite ongoing external pressures.
- Steady forward guidance from management reduces uncertainty around future performance and supports current demand for shares.
- Shares of Home Depot rose 3.16% to $294.76 intraday, with strong short-term bullish momentum and an expected trading range of $290.2 to $298.03.
Renewed demand as management maintains long-term outlook under pressure
Home Depot has reaffirmed its fiscal 2026 outlook, a move that signals management’s ongoing confidence in achieving its long-term targets despite external operating headwinds, according to Simplywall. By maintaining its guidance under persistent pressures, the company effectively reduces uncertainty surrounding future performance, which can prompt renewed investor interest. The steady stance on forward guidance is acting as a catalyst for demand in today's session.
Mixed short-term momentum as buy signals contrast with resistance
On the hourly chart, HD is trading above the MA-20 at $284.05 and MA-50 at $284.29, while still remaining below the MA-200 at $338.01. Immediate support is noted at the Ichimoku Kijun of $283.41. Among momentum indicators, MACD currently signals Buy, while ADX is Neutral. RSI holds at 55.14 (Buy) and CCI is also signaling Buy, but Stoch RSI suggests a Sell signal, and the Bull/Bear Power indicator highlights intraday buyer dominance and an overbought setup. Awesome Oscillator remains Neutral, pointing to mixed momentum readings in the short term.
Breakout risk elevated as price nears upper range boundary
In the short term, HD is expected to trade within the $290.2 to $298.03 range, a typical volatility band relative to current levels. The probability of a move higher is assessed as very high, with a breakout above $298.03 potentially opening additional upside. Conversely, if the price falls below support at $290.2, it would signal a short-term pullback scenario. Stable action within this corridor remains the base case unless these key levels are breached.
Previously it was reported that analysts expected continued downward pressure on Home Depot shares due to persistently weak technical signals. The current technical setup now signals near-term strength, with the $298.03 level serving as a critical resistance to watch for potential further upside.






Latest Home Depot News




-
 Afghanistan
-
 Albania
-
 Algeria
-
 Angola
-
 Argentina
-
 Armenia
-
 Australia
-
 Austria
-
 Azerbaijan
-
 Bahamas
-
 Bahrain
-
 Bangladesh
-
 Belarus
-
 Belgium
-
 Bolivia
-
 Botswana
-
 Brazil
-
 Brunei
-
 Bulgaria
-
 Cambodia
-
 Cameroon
-
 Canada
-
 Chile
-
 China
-
 Colombia
-
 Congo
-
 Costa Rica
-
 Cote d'Ivoire
-
 Croatia
-
 Cuba
-
 Cyprus
-
 Czechia
-
 DR Congo
-
 Denmark
-
 Dominican Republic
-
 Ecuador
-
 Egypt
-
 El Salvador
-
 Estonia
-
 Eswatini
-
 Ethiopia
-
 Finland
-
 France
-
 Georgia
-
 Germany
-
 Ghana
-
 Greece
-
 Haiti
-
 Hong Kong
-
 Hungary
-
 India
-
 Indonesia
-
 Iran, Islamic republic
-
 Iraq
-
 Ireland
-
 Israel
-
 Italy
-
 Jamaica
-
 Japan
-
 Jordan
-
 Kazakhstan
-
 Kenya
-
 Korea
-
 Kuwait
-
 Kyrgyzstan
-
 Laos
-
 Latvia
-
 Lebanon
-
 Lesotho
-
 Libya
-
 Lithuania
-
 Luxembourg
-
 Madagascar
-
 Malaysia
-
 Malta
-
 Mauritius
-
 Mexico
-
 Moldova
-
 Mongolia
-
 Montenegro
-
 Morocco
-
 Mozambique
-
 Myanmar
-
 Namibia
-
 Nepal
-
 Netherlands
-
 New Zealand
-
 Nigeria
-
 North Macedonia
-
 Norway
-
 Oman
-
 Pakistan
-
 Palestine
-
 Panama
-
 Papua New Guinea
-
 Paraguay
-
 Peru
-
 Philippines
-
 Poland
-
 Portugal
-
 Puerto Rico
-
 Qatar
-
 Reunion
-
 Romania
-
 Rwanda
-
 Saudi Arabia
-
 Serbia
-
 Singapore
-
 Slovakia
-
 Slovenia
-
 Somalia
-
 South Africa
-
 Spain
-
 Sri Lanka
-
 Sweden
-
 Switzerland
-
 Syria
-
 Taiwan
-
 Tajikistan
-
 Tanzania
-
 Thailand
-
 Trinidad and Tobago
-
 Tunisia
-
 Turkey
-
 UAE
-
 Uganda
-
 Ukraine
-
 United Kingdom
-
United States
-
 Uruguay
-
 Uzbekistan
-
 Venezuela
-
 Vietnam
-
 Yemen
-
 Zambia
-
 Zimbabwe
- Forex
- Crypto












