

Holiday season price reductions: Can Target stock break $158.43 resistance?

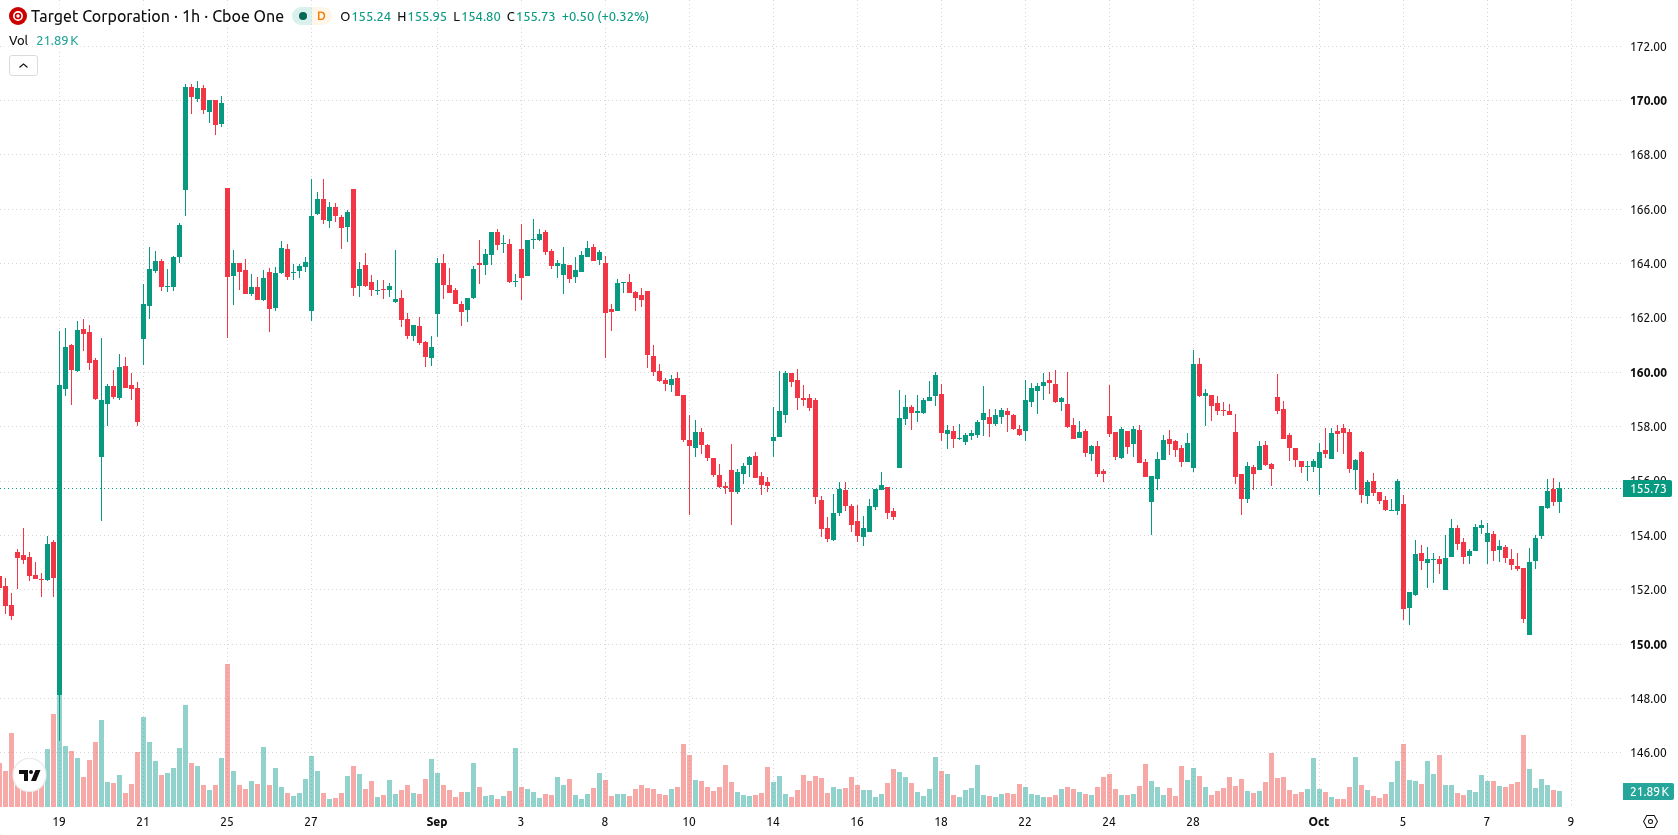
Target (TGT) stock is trading at $155.63, up 3.09% on the day and holding above its key moving averages. The price remains near its daily high, indicating strong intraday momentum and a bullish stance versus recent trend levels.
 161.90
167.57
Highlights
- Target cut prices on nearly 2,000 apparel, home, and accessories items as the holiday shopping season begins.
- The company implemented more than 10,000 price cuts over the past year to target value-focused consumers and support stock interest.
- Target stock trades in a bullish structure near its daily high, with an expected short-term range of $152.83 to $158.43 as oscillators indicate overbought conditions.
Aggressive markdowns drive value play amid holiday demand competition
Target has launched new price reductions on nearly 2,000 apparel, home, and accessories products as the holiday shopping season begins, according to Finance Yahoo. With more than 10,000 price cuts implemented over the past year, this move intensifies the company's focus on value, aiming to draw in price-sensitive shoppers during a crucial retail period. These aggressive markdowns are likely to stimulate demand and underpin renewed interest in the stock as consumers respond to Target's competitive positioning.
Momentum divergence emerges as overbought signals counter buyer strength
TGT is trading above specific moving averages, with the MA-20 at $153.44 and MA-50 at $155.01 on the H1 chart, while the long-term MA-200 lies at $129.62 on the daily chart. The nearest Ichimoku Kijun level is $153.19, acting as immediate support. Momentum indicators show strong MACD sell pressure contrasting with a neutral ADX, and the RSI registers a bullish 59.22. Both Stoch RSI and CCI are in overbought territory, with Bull/Bear Power indicating intraday buyer dominance. Oscillator extremes alongside robust recent gains suggest a divergence between price action and underlying momentum, warranting close attention to potential overextension.
Breakout hinges on price band retention amid balanced volatility risk
Looking ahead to the next 2–3 trading days, TGT is expected to stay within a range of $152.83 to $158.43, aligning with typical volatility seen at current levels. Upside continuation has a 52% probability, while a downside move is less likely at 48%. The base scenario envisions TGT holding within this established band, with a bullish breakout requiring sustained action above $158.43 and a bearish turn possible only if support near $152.83 decisively fails.
Earlier, analysts noted that despite improvements in Target's sales strategy persistent technical weakness and volatility posed ongoing risks to the stock. The current setup highlights that while TGT is now trading above key moving averages, traders should watch for a potential breakout above $158.43 or a reversal if support at $152.83 fails in the coming days.











-
 Afghanistan
-
 Albania
-
 Algeria
-
 Angola
-
 Argentina
-
 Armenia
-
 Australia
-
 Austria
-
 Azerbaijan
-
 Bahamas
-
 Bahrain
-
 Bangladesh
-
 Belarus
-
 Belgium
-
 Bolivia
-
 Botswana
-
 Brazil
-
 Brunei
-
 Bulgaria
-
 Cambodia
-
 Cameroon
-
 Canada
-
 Chile
-
 China
-
 Colombia
-
 Congo
-
 Costa Rica
-
 Cote d'Ivoire
-
 Croatia
-
 Cuba
-
 Cyprus
-
 Czechia
-
 DR Congo
-
 Denmark
-
 Dominican Republic
-
 Ecuador
-
 Egypt
-
 El Salvador
-
 Estonia
-
 Eswatini
-
 Ethiopia
-
 Finland
-
 France
-
 Georgia
-
 Germany
-
 Ghana
-
 Greece
-
 Haiti
-
 Hong Kong
-
 Hungary
-
 India
-
 Indonesia
-
 Iran, Islamic republic
-
 Iraq
-
 Ireland
-
 Israel
-
 Italy
-
 Jamaica
-
 Japan
-
 Jordan
-
 Kazakhstan
-
 Kenya
-
 Korea
-
 Kuwait
-
 Kyrgyzstan
-
 Laos
-
 Latvia
-
 Lebanon
-
 Lesotho
-
 Libya
-
 Lithuania
-
 Luxembourg
-
 Madagascar
-
 Malaysia
-
 Malta
-
 Mauritius
-
 Mexico
-
 Moldova
-
 Mongolia
-
 Montenegro
-
 Morocco
-
 Mozambique
-
 Myanmar
-
 Namibia
-
 Nepal
-
 Netherlands
-
 New Zealand
-
 Nigeria
-
 North Macedonia
-
 Norway
-
 Oman
-
 Pakistan
-
 Palestine
-
 Panama
-
 Papua New Guinea
-
 Paraguay
-
 Peru
-
 Philippines
-
 Poland
-
 Portugal
-
 Puerto Rico
-
 Qatar
-
 Reunion
-
 Romania
-
 Rwanda
-
 Saudi Arabia
-
 Serbia
-
 Singapore
-
 Slovakia
-
 Slovenia
-
 Somalia
-
 South Africa
-
 Spain
-
 Sri Lanka
-
 Sweden
-
 Switzerland
-
 Syria
-
 Taiwan
-
 Tajikistan
-
 Tanzania
-
 Thailand
-
 Trinidad and Tobago
-
 Tunisia
-
 Turkey
-
 UAE
-
 Uganda
-
 Ukraine
-
 United Kingdom
-
United States
-
 Uruguay
-
 Uzbekistan
-
 Venezuela
-
 Vietnam
-
 Yemen
-
 Zambia
-
 Zimbabwe
- Forex
- Crypto












