


Target Corporation (TGT) fell 3.35% after a wave of institutional investment and increased positions failed to sustain upward momentum. The downside move is supported by the stock slipping toward short-term support at the 50-day moving average, even as multi-timeframe moving averages reflect a lingering bullish structure.
 159.66
166.14
Highlights
- Institutional investors such as Associated Banc Corp and Rakuten Investment Management increased holdings in Target during the third quarter.
- Shares of Target posted notable year-to-date gains but sustained pricing pressure versus the broader retail equity space.
- Target stock maintains a bullish trend with key support at $156.69 and an expected five-day range of $151.98 to $163.3.
Fund inflows rise as Target attracts dividend-driven investor attention
Several institutional investors were reported to have increased their holdings in Target Corporation during the third quarter. Associated Banc Corp acquired 18,311 shares, and Rakuten Investment Management Inc. invested in 81,522 shares, as per SEC filings. Shares in Target remained a focus among dividend-paying US retail equities throughout the period, and notable year-to-date share gains were recorded, though price action has remained under broader selling pressure.
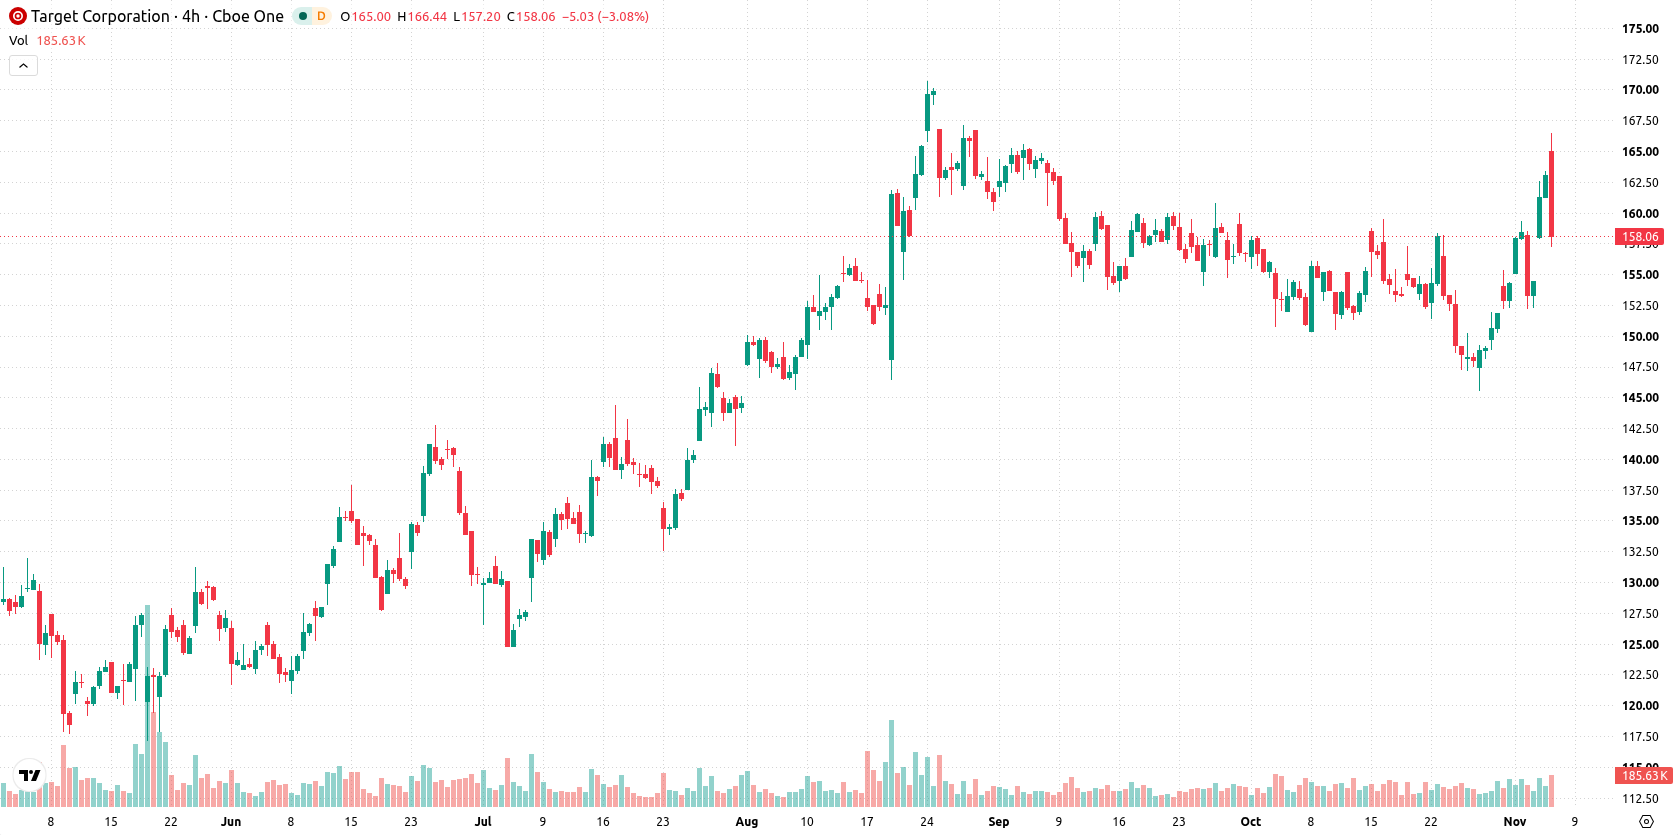
Bullish trend persists as key moving averages align but overbought risks emerge
Target is trading above its 20-day, 50-day, and 200-day moving averages at $153.91, $156.69, and $134.74, confirming bullish momentum across short, medium, and long-term trends. The near-term resistance is marked at $162.05, with immediate support found at the 50-day moving average of $156.69. A bullish alignment between the 50-day and 200-day moving averages underpins the broader trend. MACD, ADX, and RSI indicators are neutral, while the Stochastic RSI and Commodity Channel Index are in overbought territory, introducing the risk of a potential downside correction. Intraday momentum remains mixed—Bull/Bear Power shows buyers still dominate, and the Awesome Oscillator delivers a strong buy signal. However, the stock is near session lows and volatility is elevated at 2.71%, with weakness evident after the market open.
Earlier, analysts noted that institutional repositioning and ETF outflows had introduced downside risk for Target shares. The current technical alignment and increased institutional ownership add a new dimension, making the $156.69 level a critical technical threshold to monitor for potential breakout or breakdown in the near term.






Latest Target News





-
 Afghanistan
-
 Albania
-
 Algeria
-
 Angola
-
 Argentina
-
 Armenia
-
 Australia
-
 Austria
-
 Azerbaijan
-
 Bahamas
-
 Bahrain
-
 Bangladesh
-
 Belarus
-
 Belgium
-
 Bolivia
-
 Botswana
-
 Brazil
-
 Brunei
-
 Bulgaria
-
 Cambodia
-
 Cameroon
-
 Canada
-
 Chile
-
 China
-
 Colombia
-
 Congo
-
 Costa Rica
-
 Cote d'Ivoire
-
 Croatia
-
 Cuba
-
 Cyprus
-
 Czechia
-
 DR Congo
-
 Denmark
-
 Dominican Republic
-
 Ecuador
-
 Egypt
-
 El Salvador
-
 Estonia
-
 Eswatini
-
 Ethiopia
-
 Finland
-
 France
-
 Georgia
-
 Germany
-
 Ghana
-
 Greece
-
 Haiti
-
 Hong Kong
-
 Hungary
-
 India
-
 Indonesia
-
 Iran, Islamic republic
-
 Iraq
-
 Ireland
-
 Israel
-
 Italy
-
 Jamaica
-
 Japan
-
 Jordan
-
 Kazakhstan
-
 Kenya
-
 Korea
-
 Kuwait
-
 Kyrgyzstan
-
 Laos
-
 Latvia
-
 Lebanon
-
 Lesotho
-
 Libya
-
 Lithuania
-
 Luxembourg
-
 Madagascar
-
 Malaysia
-
 Malta
-
 Mauritius
-
 Mexico
-
 Moldova
-
 Mongolia
-
 Montenegro
-
 Morocco
-
 Mozambique
-
 Myanmar
-
 Namibia
-
 Nepal
-
 Netherlands
-
 New Zealand
-
 Nigeria
-
 North Macedonia
-
 Norway
-
 Oman
-
 Pakistan
-
 Palestine
-
 Panama
-
 Papua New Guinea
-
 Paraguay
-
 Peru
-
 Philippines
-
 Poland
-
 Portugal
-
 Puerto Rico
-
 Qatar
-
 Reunion
-
 Romania
-
 Rwanda
-
 Saudi Arabia
-
 Serbia
-
 Singapore
-
 Slovakia
-
 Slovenia
-
 Somalia
-
 South Africa
-
 Spain
-
 Sri Lanka
-
 Sweden
-
 Switzerland
-
 Syria
-
 Taiwan
-
 Tajikistan
-
 Tanzania
-
 Thailand
-
 Trinidad and Tobago
-
 Tunisia
-
 Turkey
-
 UAE
-
 Uganda
-
 Ukraine
-
 United Kingdom
-
United States
-
 Uruguay
-
 Uzbekistan
-
 Venezuela
-
 Vietnam
-
 Yemen
-
 Zambia
-
 Zimbabwe
- Forex
- Crypto












