


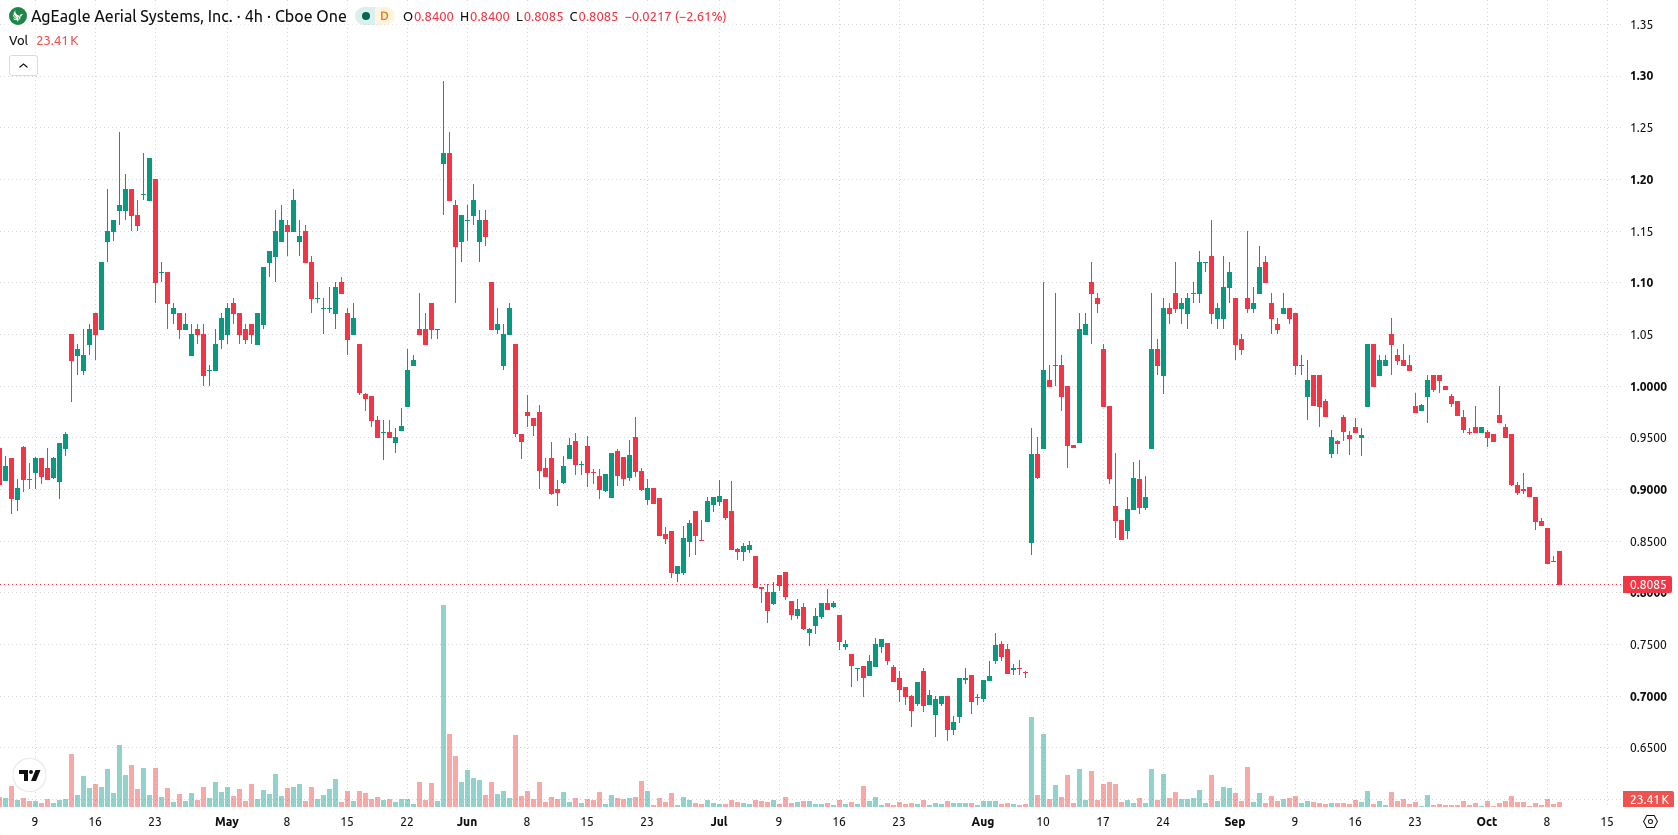
AgEagle Aerial Systems (UAVS) fell 3.10% as ongoing selling pressure dominated, with the company unable to reclaim key resistance levels. The move is supported by the stock holding below its 20-day, 50-day, and 200-day moving averages, reflecting sustained technical weakness.
 0.3199
0.4685
Highlights
- Shares of AgEagle show sustained selling pressure, with recent resistance near $0.86 and support at $0.77.
- No major corporate announcements or regulatory actions regarding AgEagle have been disclosed.
- The stock trades below technical resistance, with deeply negative momentum and an expected 5-day range of $0.74 to $0.87.
Lack of catalysts sustains negative flows and technical barriers
AgEagle has experienced sustained selling pressure across all timeframes, with persistent inability to recover technical resistance levels. Resistance was most recently reported near $0.86 and support at $0.77. No major corporate announcements or regulatory actions related to the company were disclosed.
Oversold momentum signals reinforce technical breakdown at key averages
AgEagle remains under pressure, trading beneath the 20-day, 50-day, and 200-day moving averages set at $0.96, $0.96, and $1.01, confirming seller dominance across all trends. The Ichimoku Kijun at $0.99 highlights ongoing resistance. Immediate support sits at $0.74, with the closest ceiling at $0.82. Momentum indicators are predominantly negative: RSI is deep in oversold territory at 31.19 with a sell signal, MACD is at -0.04, forecasting more downside, and ADX at 15.49 points to a weak, neutral trend. The Stochastic RSI and CCI both register as oversold, and the BBP at -0.06 underlines seller control in intraday trading. The Awesome Oscillator further indicates ongoing selling. The last trade was at $0.80, down 3.1% for the session after opening higher, with volatility for the day at 4.17%. Intraday tone remains cautious, with sellers exerting clear influence and technical momentum aligning with weaker price action.
Earlier, analysts noted that AgEagle was exhibiting sustained technical weakness and persistent selling pressure, reinforcing a broadly bearish outlook. The latest analysis affirms this view with updated technical data, highlighting $0.74 as a crucial support level that traders should monitor for signs of further breakdown.






Latest EagleNXT News




-
 Afghanistan
-
 Albania
-
 Algeria
-
 Angola
-
 Argentina
-
 Armenia
-
 Australia
-
 Austria
-
 Azerbaijan
-
 Bahamas
-
 Bahrain
-
 Bangladesh
-
 Belarus
-
 Belgium
-
 Bolivia
-
 Botswana
-
 Brazil
-
 Brunei
-
 Bulgaria
-
 Cambodia
-
 Cameroon
-
 Canada
-
 Chile
-
 China
-
 Colombia
-
 Congo
-
 Costa Rica
-
 Cote d'Ivoire
-
 Croatia
-
 Cuba
-
 Cyprus
-
 Czechia
-
 DR Congo
-
 Denmark
-
 Dominican Republic
-
 Ecuador
-
 Egypt
-
 El Salvador
-
 Estonia
-
 Eswatini
-
 Ethiopia
-
 Finland
-
 France
-
 Georgia
-
 Germany
-
 Ghana
-
 Greece
-
 Haiti
-
 Hong Kong
-
 Hungary
-
 India
-
 Indonesia
-
 Iran, Islamic republic
-
 Iraq
-
 Ireland
-
 Israel
-
 Italy
-
 Jamaica
-
 Japan
-
 Jordan
-
 Kazakhstan
-
 Kenya
-
 Korea
-
 Kuwait
-
 Kyrgyzstan
-
 Laos
-
 Latvia
-
 Lebanon
-
 Lesotho
-
 Libya
-
 Lithuania
-
 Luxembourg
-
 Madagascar
-
 Malaysia
-
 Malta
-
 Mauritius
-
 Mexico
-
 Moldova
-
 Mongolia
-
 Montenegro
-
 Morocco
-
 Mozambique
-
 Myanmar
-
 Namibia
-
 Nepal
-
 Netherlands
-
 New Zealand
-
 Nigeria
-
 North Macedonia
-
 Norway
-
 Oman
-
 Pakistan
-
 Palestine
-
 Panama
-
 Papua New Guinea
-
 Paraguay
-
 Peru
-
 Philippines
-
 Poland
-
 Portugal
-
 Puerto Rico
-
 Qatar
-
 Reunion
-
 Romania
-
 Rwanda
-
 Saudi Arabia
-
 Serbia
-
 Singapore
-
 Slovakia
-
 Slovenia
-
 Somalia
-
 South Africa
-
 Spain
-
 Sri Lanka
-
 Sweden
-
 Switzerland
-
 Syria
-
 Taiwan
-
 Tajikistan
-
 Tanzania
-
 Thailand
-
 Trinidad and Tobago
-
 Tunisia
-
 Turkey
-
 UAE
-
 Uganda
-
 Ukraine
-
 United Kingdom
-
United States
-
 Uruguay
-
 Uzbekistan
-
 Venezuela
-
 Vietnam
-
 Yemen
-
 Zambia
-
 Zimbabwe
- Forex
- Crypto












