

Cisco stock extends downward price move amid overbought conditions and pressure near support

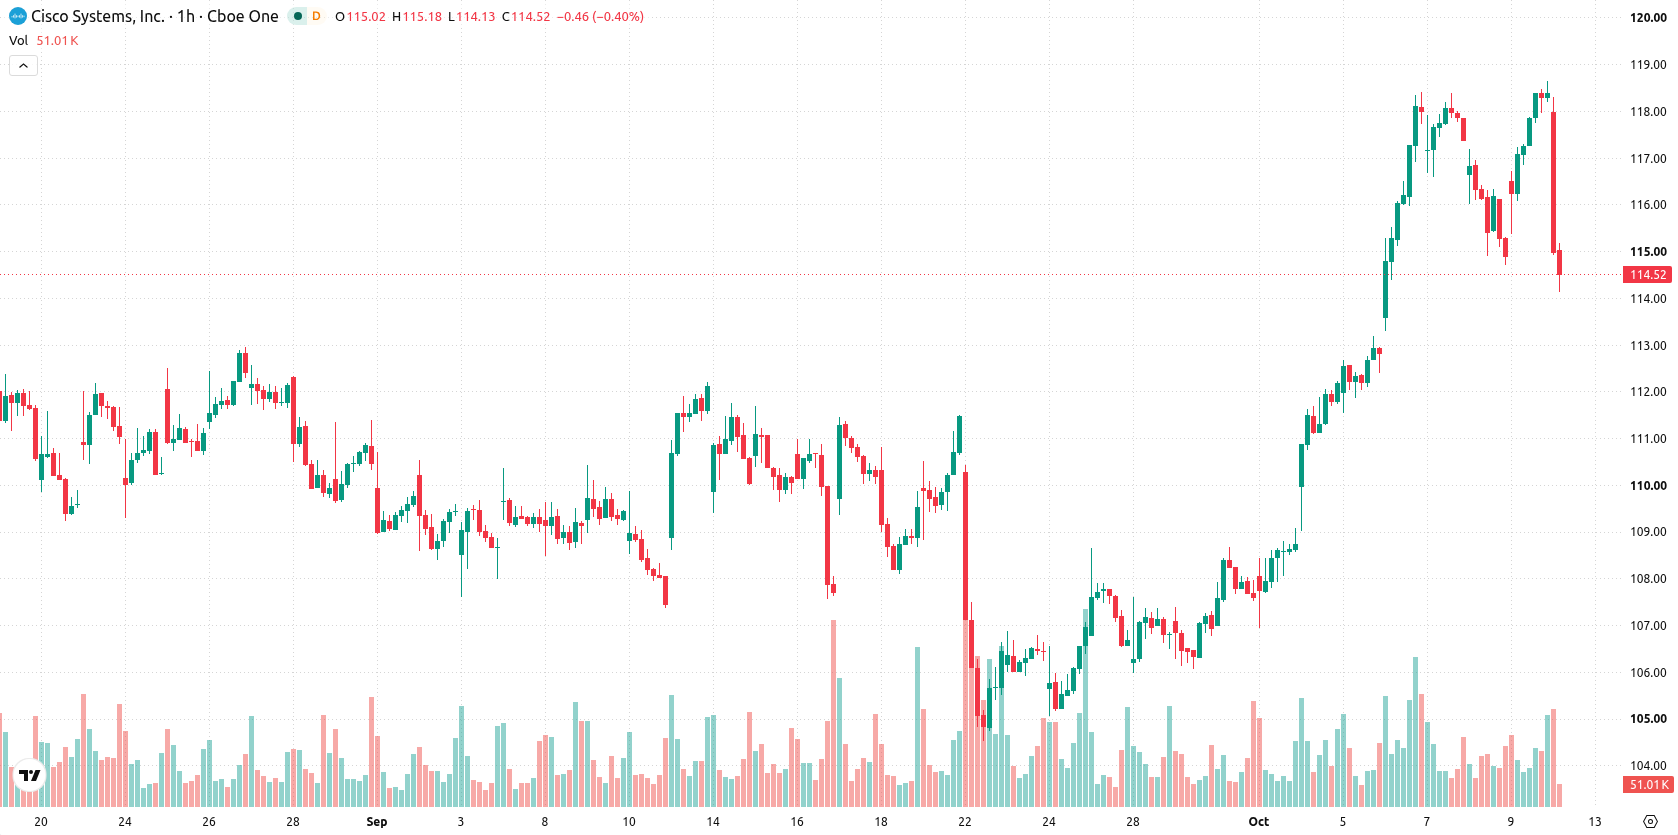
Cisco (CSCO) stock is trading at $114.47, marking a 3.3% decline on the day and sitting near the low end of its daily range in a session that has seen low volatility. The stock is currently positioned below its short-term moving averages but maintains support above longer-term trend indicators.
 115.37
118.64
115.37
118.64
Highlights
- Cisco projects restructuring costs of up to $1 billion to be substantially completed by the end of fiscal 2027.
- The company distributed $3.2 billion to shareholders in fiscal Q4 through dividends and share repurchases, maintaining its $0.42 per share quarterly dividend.
- Shares of Cisco have dropped 3.3% on the day, oscillators flag overbought conditions, and price is projected to hold within a $112.44 to $120.24 range over the next 2 to 3 days.
Restructuring drives caution as capital returns counter selling pressure
Cisco disclosed that restructuring costs may reach $1 billion, a plan the company expects to substantially complete by the end of fiscal 2027, communicating upcoming changes to its operational structure that could impact costs and future strategy. The company also declared a quarterly dividend of $0.42 per share, set for payment on October 21 to shareholders of record as of October 2, and returned $3.2 billion to shareholders in fiscal Q4 through dividends and share repurchases, according to Beinsure. These actions reflect a mix of direct capital distribution and anticipated restructuring, though price action has remained under broader selling pressure.
Overbought signals emerge as upward momentum contends with resistance
On the hourly chart, CSCO is positioned below the MA-20 at $117.06 while finding support above the MA-50 at $114.17. On the daily timeframe, the stock remains above the MA-200 at $98.69. The Ichimoku Kijun at $116.68 currently marks immediate resistance. Momentum signals such as MACD and ADX indicate a buy bias, and the RSI registers a buy reading. However, both the Stoch RSI and CCI are signaling overbought conditions, and several oscillators flag stretched momentum. Bull/Bear Power shows buyers are dominating intraday momentum, and the Awesome Oscillator remains aligned with the prevailing trend. The divergence between overbought oscillators and upward momentum increases the risk of a near-term reversal.
Rangebound outlook holds as break levels dictate direction
Over the next 2 to 3 trading days, CSCO is expected to fluctuate within a typical volatility band of $112.44 to $120.24. The probability of an upward or downward move is evenly balanced at 50%. The baseline scenario projects that the stock will remain rangebound between these levels. A bullish development would require a break above resistance at $116.68, enabling a move toward the higher end of the range, while a loss of support at $112.44 would likely accelerate selling.
Previously it was reported that Cisco demonstrated technical resilience alongside renewed buying momentum, setting the stage for further upside potential. The latest developments introduce heightened uncertainty due to upcoming restructuring costs and balanced momentum signals, positioning $116.68 as the key resistance level to watch for a potential bullish breakout in the near term.









-
 Afghanistan
-
 Albania
-
 Algeria
-
 Angola
-
 Argentina
-
 Armenia
-
 Australia
-
 Austria
-
 Azerbaijan
-
 Bahamas
-
 Bahrain
-
 Bangladesh
-
 Belarus
-
 Belgium
-
 Bolivia
-
 Botswana
-
 Brazil
-
 Brunei
-
 Bulgaria
-
 Cambodia
-
 Cameroon
-
 Canada
-
 Chile
Chile
-
 China
China
-
 Colombia
-
 Congo
Congo
-
 Costa Rica
-
 Cote d'Ivoire
-
 Croatia
-
 Cuba
Cuba
-
 Cyprus
-
 Czechia
-
 DR Congo
-
 Denmark
-
 Dominican Republic
-
 Ecuador
-
 Egypt
Egypt
-
 El Salvador
-
 Estonia
-
 Eswatini
-
 Ethiopia
-
 Finland
-
 France
-
 Georgia
-
 Germany
-
 Ghana
Ghana
-
 Greece
-
 Haiti
Haiti
-
 Hong Kong
-
 Hungary
-
 India
India
-
 Indonesia
-
 Iran, Islamic republic
-
 Iraq
Iraq
-
 Ireland
-
 Israel
-
 Italy
Italy
-
 Jamaica
-
 Japan
Japan
-
 Jordan
-
 Kazakhstan
-
 Kenya
Kenya
-
 Korea
Korea
-
 Kuwait
-
 Kyrgyzstan
-
 Laos
Laos
-
 Latvia
-
 Lebanon
-
 Lesotho
-
 Libya
Libya
-
 Lithuania
-
 Luxembourg
-
 Madagascar
-
 Malaysia
-
 Malta
Malta
-
 Mauritius
-
 Mexico
-
 Moldova
-
 Mongolia
-
 Montenegro
-
 Morocco
-
 Mozambique
-
 Myanmar
-
 Namibia
-
 Nepal
Nepal
-
 Netherlands
-
 New Zealand
-
 Nigeria
-
 North Macedonia
-
 Norway
-
 Oman
Oman
-
 Pakistan
-
 Palestine
-
 Panama
-
 Papua New Guinea
-
 Paraguay
-
 Peru
Peru
-
 Philippines
-
 Poland
-
 Portugal
-
 Puerto Rico
-
 Qatar
Qatar
-
 Reunion
-
 Romania
-
 Rwanda
-
 Saudi Arabia
-
 Serbia
-
 Singapore
-
 Slovakia
-
 Slovenia
-
 Somalia
-
 South Africa
-
 Spain
Spain
-
 Sri Lanka
-
 Sweden
-
 Switzerland
-
 Syria
Syria
-
 Taiwan
-
 Tajikistan
-
 Tanzania
-
 Thailand
-
 Trinidad and Tobago
-
 Tunisia
-
 Turkey
-
 UAE
UAE
-
 Uganda
-
 Ukraine
-
 United Kingdom
-
United States
-
 Uruguay
-
 Uzbekistan
-
 Venezuela
-
 Vietnam
-
 Yemen
Yemen
-
 Zambia
-
 Zimbabwe
- Forex
- Crypto












