


Dutch Bros Inc (BROS) fell 3.00% after setting a new 52-week low, as recent lack of corporate actions left the stock exposed to ongoing downside momentum. The move is supported by negative technical signals, with BROS trading below all its major moving averages.
 37.93
40.06
37.93
40.06
Highlights
- Dutch Bros stock reached a 52-week low with no reported corporate actions, regulatory changes, or product developments.
- Shares traded below major moving averages and closed near the session low at $36.9, down 3%.
- Technical indicators project strong downside continuation with a forecasted 5-day range of $35.82 to $37.98.
Prolonged absence of catalysts weighs as sentiment turns defensive
Dutch Bros Inc. reached a 52-week low according to recent updates. No new corporate actions, regulatory changes, or product developments were reported for the company.
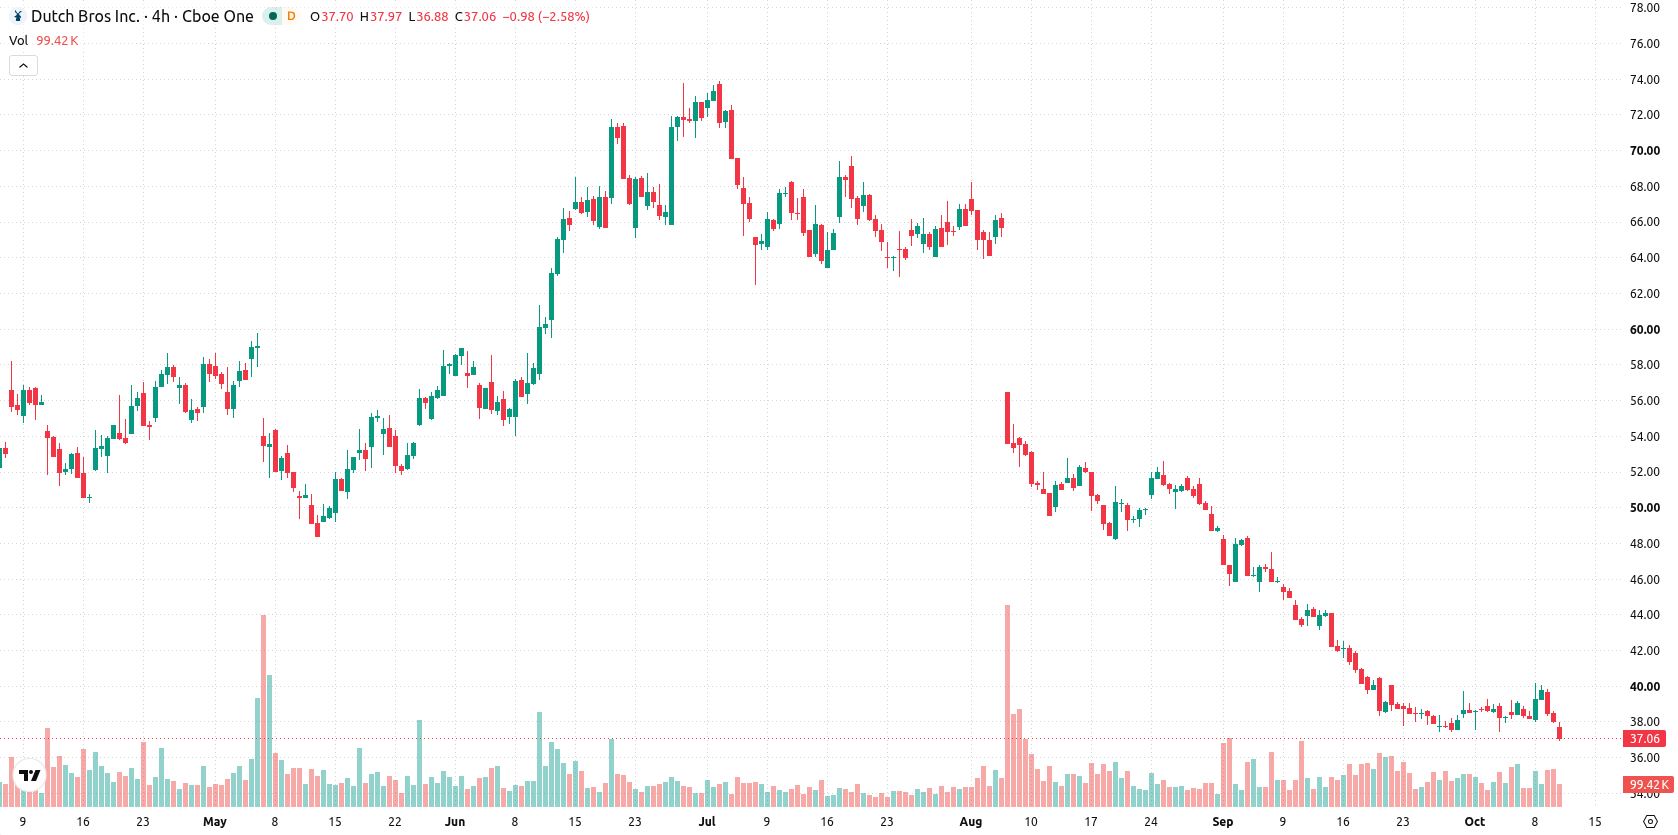
Bearish momentum builds as all key averages breached and sellers dominate
Dutch Bros is trading below its 20-day, 50-day, and 200-day moving averages at $39.27, $46.5, and $54.94, respectively, which signals seller pressure across all timeframes. The MA-50 is positioned below the MA-200, confirming a bearish trend. The nearest resistance is at $37.06 with support at $35.82. Negative momentum dominates, as the MACD and ADX indicate continued downside risk. The RSI is near 34 and suggests the stock is oversold with a strong sell signal, while Stochastic RSI strengthens the bearish view. CCI and Awesome Oscillator are both neutral, implying minimal engagement from buyers or sellers. Bull/Bear Power remains positive intraday at 0.7, flagging overbought conditions despite falling prices. The stock now trades near session lows with intraday volatility at 3.13%, highlighting persistent sell pressure since the open.
Earlier, analysts noted that Dutch Bros was experiencing sustained bearish momentum as downside signals dominated the technical outlook. The current analysis reinforces this view, with new lows and persistent negative momentum indicating traders should closely monitor the support at $35.82 for signs of continued weakness or a potential inflection.





Latest Dutch Bros News





-
 Afghanistan
-
 Albania
-
 Algeria
-
 Angola
-
 Argentina
-
 Armenia
-
 Australia
-
 Austria
-
 Azerbaijan
-
 Bahamas
-
 Bahrain
-
 Bangladesh
-
 Belarus
-
 Belgium
-
 Bolivia
-
 Botswana
-
 Brazil
-
 Brunei
-
 Bulgaria
-
 Cambodia
-
 Cameroon
-
 Canada
-
 Chile
Chile
-
 China
China
-
 Colombia
-
 Congo
Congo
-
 Costa Rica
-
 Cote d'Ivoire
-
 Croatia
-
 Cuba
Cuba
-
 Cyprus
-
 Czechia
-
 DR Congo
-
 Denmark
-
 Dominican Republic
-
 Ecuador
-
 Egypt
Egypt
-
 El Salvador
-
 Estonia
-
 Eswatini
-
 Ethiopia
-
 Finland
-
 France
-
 Georgia
-
 Germany
-
 Ghana
Ghana
-
 Greece
-
 Haiti
Haiti
-
 Hong Kong
-
 Hungary
-
 India
India
-
 Indonesia
-
 Iran, Islamic republic
-
 Iraq
Iraq
-
 Ireland
-
 Israel
-
 Italy
Italy
-
 Jamaica
-
 Japan
Japan
-
 Jordan
-
 Kazakhstan
-
 Kenya
Kenya
-
 Korea
Korea
-
 Kuwait
-
 Kyrgyzstan
-
 Laos
Laos
-
 Latvia
-
 Lebanon
-
 Lesotho
-
 Libya
Libya
-
 Lithuania
-
 Luxembourg
-
 Madagascar
-
 Malaysia
-
 Malta
Malta
-
 Mauritius
-
 Mexico
-
 Moldova
-
 Mongolia
-
 Montenegro
-
 Morocco
-
 Mozambique
-
 Myanmar
-
 Namibia
-
 Nepal
Nepal
-
 Netherlands
-
 New Zealand
-
 Nigeria
-
 North Macedonia
-
 Norway
-
 Oman
Oman
-
 Pakistan
-
 Palestine
-
 Panama
-
 Papua New Guinea
-
 Paraguay
-
 Peru
Peru
-
 Philippines
-
 Poland
-
 Portugal
-
 Puerto Rico
-
 Qatar
Qatar
-
 Reunion
-
 Romania
-
 Rwanda
-
 Saudi Arabia
-
 Serbia
-
 Singapore
-
 Slovakia
-
 Slovenia
-
 Somalia
-
 South Africa
-
 Spain
Spain
-
 Sri Lanka
-
 Sweden
-
 Switzerland
-
 Syria
Syria
-
 Taiwan
-
 Tajikistan
-
 Tanzania
-
 Thailand
-
 Trinidad and Tobago
-
 Tunisia
-
 Turkey
-
 UAE
UAE
-
 Uganda
-
 Ukraine
-
 United Kingdom
-
United States
-
 Uruguay
-
 Uzbekistan
-
 Venezuela
-
 Vietnam
-
 Yemen
Yemen
-
 Zambia
-
 Zimbabwe
- Forex
- Crypto












