


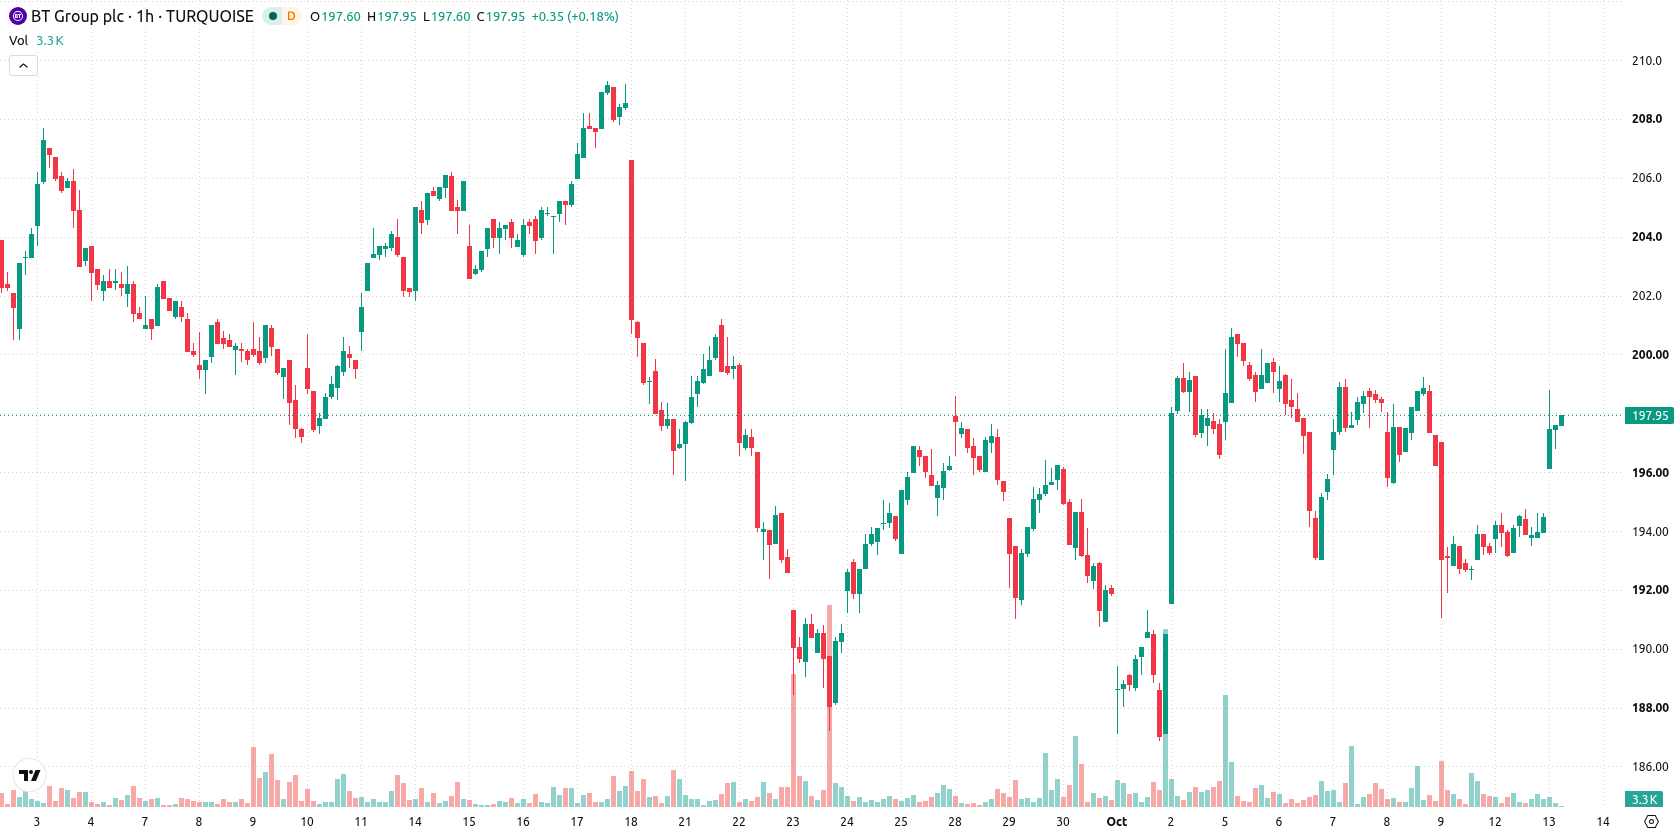
BT Group (BT-A) stock is trading at GBX194.45, posting a modest gain for the session. The price currently sits above its short-term moving averages but continues to hold below medium- and long-term trend levels.
 194.80
200.10
194.80
200.10
Highlights
- BT Group expands its strategic partnership with Microsoft to strengthen cybersecurity offerings for UK enterprise and public sector clients.
- The collaboration integrates Microsoft security technology with BT’s network expertise to address rising AI-driven cyber threats.
- Shares of BT Group trade in a sideways range of GBX190.22 to GBX198.68, with short-term buying interest but broader momentum favoring sellers.
Cybersecurity appeal grows amid Microsoft partnership and AI threat concerns
BT Group has announced an expanded strategic partnership with Microsoft to help defend UK organisations against rising AI-driven cyber threats, according to Newsroom Bt. By combining Microsoft security technology with BT’s broad network operations and operational insight, BT Group is positioned to enhance its cybersecurity offering to large enterprise and public sector clients. The collaboration is expected to strengthen service capability and could improve BT Group’s appeal among organisations seeking advanced cyber protection solutions.
Mixed technical signals create uncertainty despite short-term gains
On the hourly chart, the price is trading above the MA-20 of GBX193.92 but remains below the MA-50 at GBX196.24. On the daily timeframe, BT-A continues to trade below the MA-200 at GBX202.89. The immediate resistance is set by the Ichimoku Kijun line at GBX194.95, while the GBX190.22 level represents a nearby support zone. Technical indicators provide a mixed outlook: MACD shows a strong sell signal, ADX is neutral, and RSI is at 48.28 with a sell reading. Stochastic RSI is in overbought territory, CCI is neutral, and Bull/Bear Power also highlights overbought conditions. Awesome Oscillator shows no clear direction. Divergences between oscillators and momentum signals point to heightened uncertainty, with short-term bullishness failing to gain confirmation from broader momentum measures.
Downside risk outweighs bullish breakout under current volatility band
In the near term, BT-A is expected to fluctuate within a range of GBX190.22 to GBX198.68, representing its typical volatility band relative to current levels. The probability model assigns a 40% chance to an upward move and a 60% likelihood for a decline over the next several sessions. Sideways movement within the defined corridor remains the baseline scenario; a potential bullish breakout requires a close above the Ichimoku Kijun resistance, while a bearish case is confirmed if the price slips below GBX190.22.
Earlier, analysts noted that BT Group was facing key technical headwinds amid ongoing regulatory uncertainty surrounding its major pending acquisition. The latest developments—highlighted by a new cybersecurity partnership with Microsoft and ongoing technical divergence—add a strategic dimension, but the immediate focus remains on whether BT-A can sustain levels above GBX190.22 to avoid renewed downside pressure.





Latest BT Group News






-
 Afghanistan
-
 Albania
-
 Algeria
-
 Angola
-
 Argentina
-
 Armenia
-
 Australia
-
 Austria
-
 Azerbaijan
-
 Bahamas
-
 Bahrain
-
 Bangladesh
-
 Belarus
-
 Belgium
-
 Bolivia
-
 Botswana
-
 Brazil
-
 Brunei
-
 Bulgaria
-
 Cambodia
-
 Cameroon
-
 Canada
-
 Chile
Chile
-
 China
China
-
 Colombia
-
 Congo
Congo
-
 Costa Rica
-
 Cote d'Ivoire
-
 Croatia
-
 Cuba
Cuba
-
 Cyprus
-
 Czechia
-
 DR Congo
-
 Denmark
-
 Dominican Republic
-
 Ecuador
-
 Egypt
Egypt
-
 El Salvador
-
 Estonia
-
 Eswatini
-
 Ethiopia
-
 Finland
-
 France
-
 Georgia
-
 Germany
-
 Ghana
Ghana
-
 Greece
-
 Haiti
Haiti
-
 Hong Kong
-
 Hungary
-
 India
India
-
 Indonesia
-
 Iran, Islamic republic
-
 Iraq
Iraq
-
 Ireland
-
 Israel
-
 Italy
Italy
-
 Jamaica
-
 Japan
Japan
-
 Jordan
-
 Kazakhstan
-
 Kenya
Kenya
-
 Korea
Korea
-
 Kuwait
-
 Kyrgyzstan
-
 Laos
Laos
-
 Latvia
-
 Lebanon
-
 Lesotho
-
 Libya
Libya
-
 Lithuania
-
 Luxembourg
-
 Madagascar
-
 Malaysia
-
 Malta
Malta
-
 Mauritius
-
 Mexico
-
 Moldova
-
 Mongolia
-
 Montenegro
-
 Morocco
-
 Mozambique
-
 Myanmar
-
 Namibia
-
 Nepal
Nepal
-
 Netherlands
-
 New Zealand
-
 Nigeria
-
 North Macedonia
-
 Norway
-
 Oman
Oman
-
 Pakistan
-
 Palestine
-
 Panama
-
 Papua New Guinea
-
 Paraguay
-
 Peru
Peru
-
 Philippines
-
 Poland
-
 Portugal
-
 Puerto Rico
-
 Qatar
Qatar
-
 Reunion
-
 Romania
-
 Rwanda
-
 Saudi Arabia
-
 Serbia
-
 Singapore
-
 Slovakia
-
 Slovenia
-
 Somalia
-
 South Africa
-
 Spain
Spain
-
 Sri Lanka
-
 Sweden
-
 Switzerland
-
 Syria
Syria
-
 Taiwan
-
 Tajikistan
-
 Tanzania
-
 Thailand
-
 Trinidad and Tobago
-
 Tunisia
-
 Turkey
-
 UAE
UAE
-
 Uganda
-
 Ukraine
-
 United Kingdom
-
United States
-
 Uruguay
-
 Uzbekistan
-
 Venezuela
-
 Vietnam
-
 Yemen
Yemen
-
 Zambia
-
 Zimbabwe
- Forex
- Crypto












