

BT Group stock slides as seller pressure and oversold signals cap downside near support

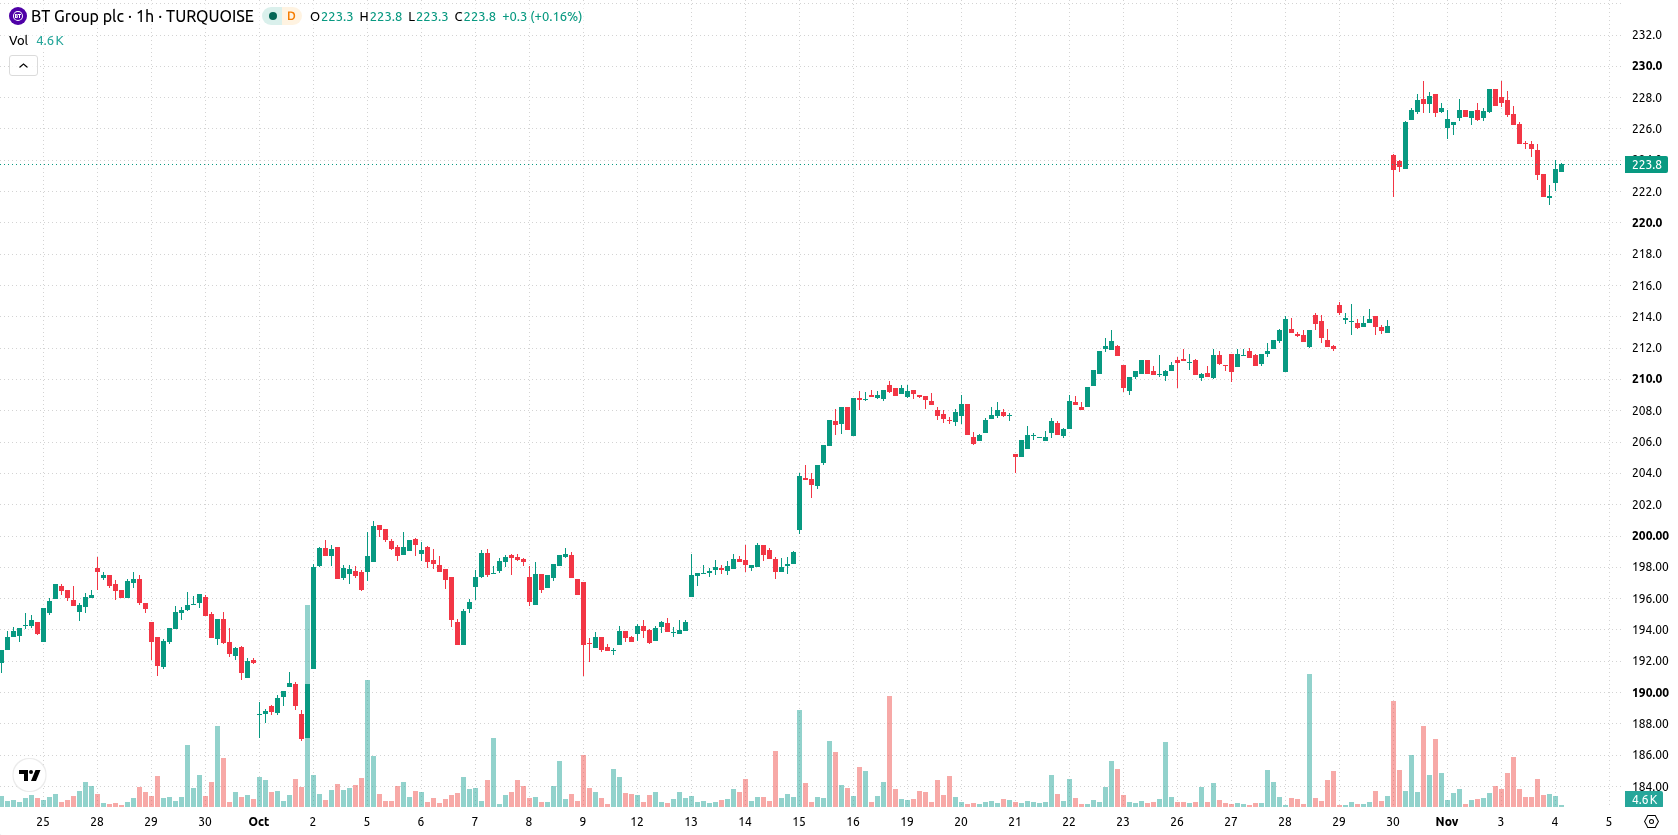
BT Group (BT-A) stock is trading at GBX221.6, marking a 2.68% decline for the day. The price sits below its short-term averages but remains above medium and long-term benchmarks, indicating a mixed technical stance in the current session.
 224.50
229.40
Highlights
- BT Group stock is experiencing short-term selling pressure but retains longer-term technical support.
- Momentum signals are strong but diverge from oversold oscillators, with selling exhaustion indicated by Stoch RSI and CCI.
- Shares are expected to trade between GBX212.16 and GBX231.04 in the coming days, with a 67% chance of an upturn.
Momentum and resistance diverge as oscillators highlight seller pressure
On the technical front, BT-A is trading below the MA-20 at GBX226.01 but above the MA-50 at GBX220.04 and the MA-200 at GBX205.1. Immediate resistance is defined by the Ichimoku Kijun at GBX225.25. MACD indicates strong upside momentum and ADX suggests the underlying trend retains strength. However, momentum readings contrast with oscillator signals: RSI is neutral, while Stoch RSI and CCI are both oversold, which may flag selling exhaustion. Bull/Bear Power remains negative, reflecting ongoing dominance by sellers in the intraday tape, while the Awesome Oscillator reads as neutral. The asset is currently near session lows on low volatility.
Upside probability grows as range-bound consolidation prevails
Looking forward, the expected trading range for BT-A over the coming days is between GBX212.16 and GBX231.04. Probabilities tilt towards an upward move (67%), with downside risk estimated at 33%. In the baseline scenario, the price may consolidate within this band in line with typical volatility. A sustained breakout above GBX225.25 would open a bullish path, while a close below GBX212.16 could trigger further declines.
Earlier, analysts noted that BT Group's technical resilience and completed infrastructure projects supported a bullish outlook. The current setup introduces a more mixed technical picture, so traders should closely watch the GBX225.25 resistance for signs of a renewed upward move or further consolidation within the prevailing range.











-
 Afghanistan
-
 Albania
-
 Algeria
-
 Angola
-
 Argentina
-
 Armenia
-
 Australia
-
 Austria
-
 Azerbaijan
-
 Bahamas
-
 Bahrain
-
 Bangladesh
-
 Belarus
-
 Belgium
-
 Bolivia
-
 Botswana
-
 Brazil
-
 Brunei
-
 Bulgaria
-
 Cambodia
-
 Cameroon
-
 Canada
-
 Chile
-
 China
-
 Colombia
-
 Congo
-
 Costa Rica
-
 Cote d'Ivoire
-
 Croatia
-
 Cuba
-
 Cyprus
-
 Czechia
-
 DR Congo
-
 Denmark
-
 Dominican Republic
-
 Ecuador
-
 Egypt
-
 El Salvador
-
 Estonia
-
 Eswatini
-
 Ethiopia
-
 Finland
-
 France
-
 Georgia
-
 Germany
-
 Ghana
-
 Greece
-
 Haiti
-
 Hong Kong
-
 Hungary
-
 India
-
 Indonesia
-
 Iran, Islamic republic
-
 Iraq
-
 Ireland
-
 Israel
-
 Italy
-
 Jamaica
-
 Japan
-
 Jordan
-
 Kazakhstan
-
 Kenya
-
 Korea
-
 Kuwait
-
 Kyrgyzstan
-
 Laos
-
 Latvia
-
 Lebanon
-
 Lesotho
-
 Libya
-
 Lithuania
-
 Luxembourg
-
 Madagascar
-
 Malaysia
-
 Malta
-
 Mauritius
-
 Mexico
-
 Moldova
-
 Mongolia
-
 Montenegro
-
 Morocco
-
 Mozambique
-
 Myanmar
-
 Namibia
-
 Nepal
-
 Netherlands
-
 New Zealand
-
 Nigeria
-
 North Macedonia
-
 Norway
-
 Oman
-
 Pakistan
-
 Palestine
-
 Panama
-
 Papua New Guinea
-
 Paraguay
-
 Peru
-
 Philippines
-
 Poland
-
 Portugal
-
 Puerto Rico
-
 Qatar
-
 Reunion
-
 Romania
-
 Rwanda
-
 Saudi Arabia
-
 Serbia
-
 Singapore
-
 Slovakia
-
 Slovenia
-
 Somalia
-
 South Africa
-
 Spain
-
 Sri Lanka
-
 Sweden
-
 Switzerland
-
 Syria
-
 Taiwan
-
 Tajikistan
-
 Tanzania
-
 Thailand
-
 Trinidad and Tobago
-
 Tunisia
-
 Turkey
-
 UAE
-
 Uganda
-
 Ukraine
-
 United Kingdom
-
United States
-
 Uruguay
-
 Uzbekistan
-
 Venezuela
-
 Vietnam
-
 Yemen
-
 Zambia
-
 Zimbabwe
- Forex
- Crypto












