

Microsoft hits record close and ups dividend: Can MSFT stock continue gains?

Microsoft (MSFT) stock is trading at $544.99, marking a modest daily gain. The price sits above its key moving averages, reflecting prevailing bullish momentum.
 549.22
542.67
549.22
542.67
Highlights
- Microsoft stock reached a record closing price of $541.15, surpassing prior technical ceilings and attracting demand.
- The company approved a dividend increase to $0.98 per share and reported a $9.6 million data fine as manageable regulatory expense.
- Bullish momentum dominates with price expected to range between $534.34 and $555.64, with a low probability of reversal in the short term.
All-time highs drive sentiment as regulatory and dividend factors emerge
Microsoft's record closing price of $541.15, as reported by 24/7 Wall St., marks a new all-time high and removes previous technical barriers, encouraging positive investor sentiment and reinforcing underlying demand. The company's recently announced dividend increase to $0.98 per share, with the upcoming payment established by Defenseworld, enhances the stock’s income appeal and may incrementally support passive inflows. Meanwhile, President Brad Smith's advocacy for strong AI regulation on October 13, 2026, according to Gurufocus, and a $9.6 million data violation fine by the Norwegian Data Protection Authority provide a context of both proactive risk management and manageable regulatory costs.
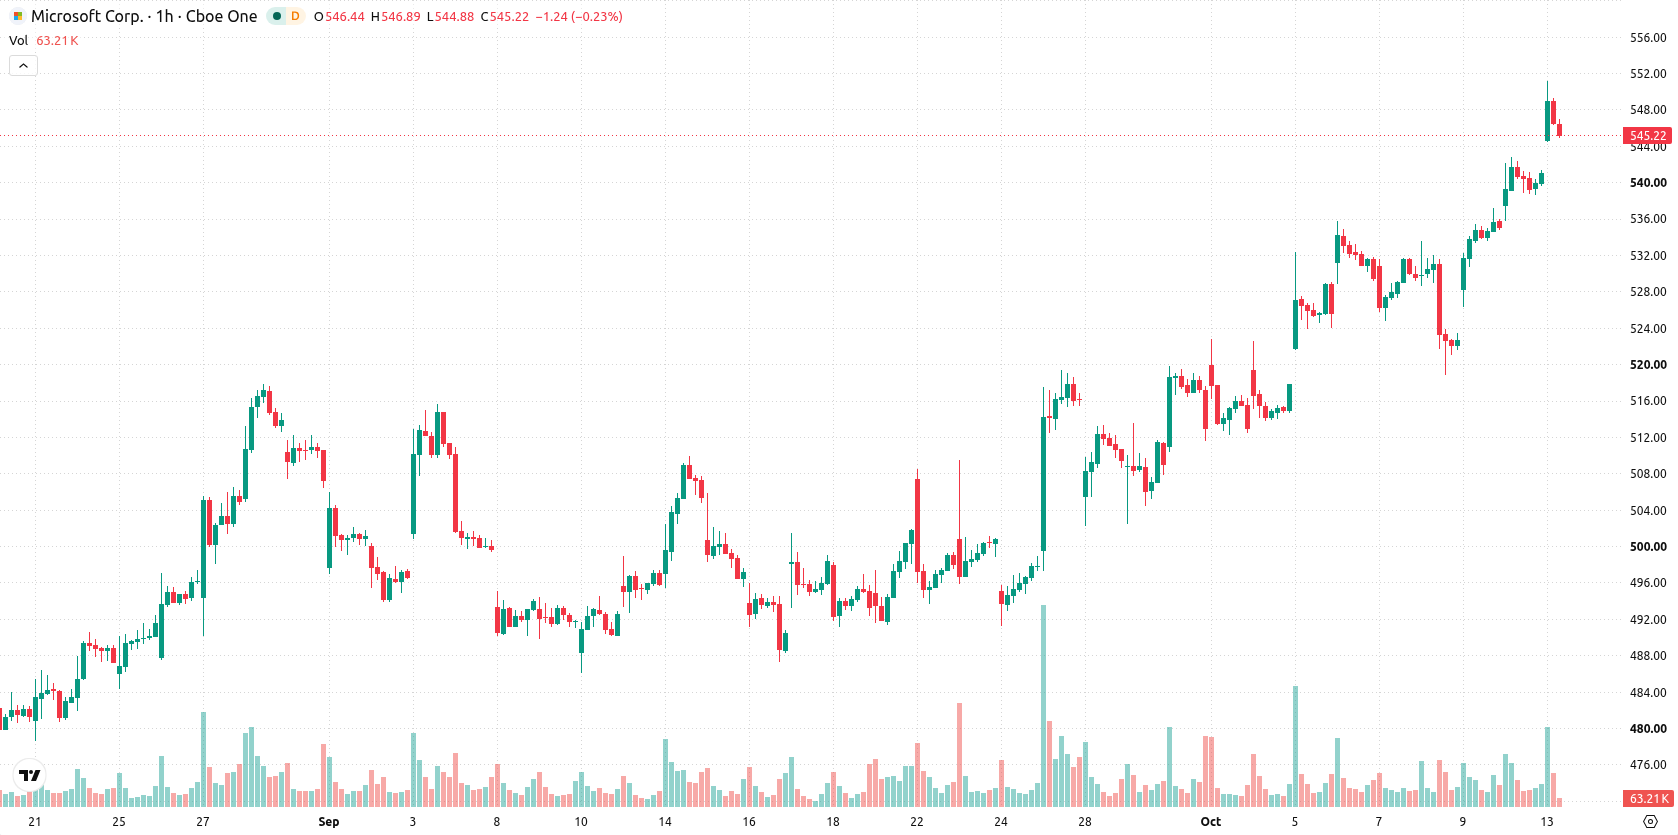
Intraday pullback tempers strength as momentum and support indicators remain firm
On the technical side, price remains above the MA-20 and MA-50 on the current timeframe and is well above the MA-200 on the daily chart. The Ichimoku Kijun level at $530.77 serves as immediate support. MACD and ADX are positive, with RSI at 67.32 and CCI both pointing to buying territory, while Stochastic RSI and the Awesome Oscillator are neutral. Bull/Bear Power is currently overbought, reflecting intraday buyer dominance. Although there was a $7.62 gap up, price action has retreated toward today’s low, and volatility remains subdued, hinting at mild hesitation amid strong overall momentum signals. Notably, an intraday pullback from session highs contrasts with persistent strength in the momentum oscillators.
High probability of gains as immediate downside risk remains low
Near-term, the outlook favors an upward move with price expected to range between $534.34 and $555.64 over the next few sessions. The probability of an advance is considered very high, with downside risk in the immediate term appearing low. Under a bullish scenario, price may break above $555.64 on strong buying. Alternatively, a reversal would likely be triggered by a drop below immediate support at $530.77, but this scenario currently appears unlikely.
Earlier, analysts noted that aggregate S&P 500 profit growth was heavily reliant on technology and energy sectors, highlighting heightened sensitivity to developments within those industries. With Microsoft shares setting new highs and displaying sustained technical strength, traders should closely monitor price reaction at the $555.64 resistance, as a break above this level may signal further upward momentum.





Latest Microsoft News





-
 Afghanistan
-
 Albania
-
 Algeria
-
 Angola
-
 Argentina
-
 Armenia
-
 Australia
-
 Austria
-
 Azerbaijan
-
 Bahamas
-
 Bahrain
-
 Bangladesh
-
 Belarus
-
 Belgium
-
 Bolivia
-
 Botswana
-
 Brazil
-
 Brunei
-
 Bulgaria
-
 Cambodia
-
 Cameroon
-
 Canada
-
 Chile
Chile
-
 China
China
-
 Colombia
-
 Congo
Congo
-
 Costa Rica
-
 Cote d'Ivoire
-
 Croatia
-
 Cuba
Cuba
-
 Cyprus
-
 Czechia
-
 DR Congo
-
 Denmark
-
 Dominican Republic
-
 Ecuador
-
 Egypt
Egypt
-
 El Salvador
-
 Estonia
-
 Eswatini
-
 Ethiopia
-
 Finland
-
 France
-
 Georgia
-
 Germany
-
 Ghana
Ghana
-
 Greece
-
 Haiti
Haiti
-
 Hong Kong
-
 Hungary
-
 India
India
-
 Indonesia
-
 Iran, Islamic republic
-
 Iraq
Iraq
-
 Ireland
-
 Israel
-
 Italy
Italy
-
 Jamaica
-
 Japan
Japan
-
 Jordan
-
 Kazakhstan
-
 Kenya
Kenya
-
 Korea
Korea
-
 Kuwait
-
 Kyrgyzstan
-
 Laos
Laos
-
 Latvia
-
 Lebanon
-
 Lesotho
-
 Libya
Libya
-
 Lithuania
-
 Luxembourg
-
 Madagascar
-
 Malaysia
-
 Malta
Malta
-
 Mauritius
-
 Mexico
-
 Moldova
-
 Mongolia
-
 Montenegro
-
 Morocco
-
 Mozambique
-
 Myanmar
-
 Namibia
-
 Nepal
Nepal
-
 Netherlands
-
 New Zealand
-
 Nigeria
-
 North Macedonia
-
 Norway
-
 Oman
Oman
-
 Pakistan
-
 Palestine
-
 Panama
-
 Papua New Guinea
-
 Paraguay
-
 Peru
Peru
-
 Philippines
-
 Poland
-
 Portugal
-
 Puerto Rico
-
 Qatar
Qatar
-
 Reunion
-
 Romania
-
 Rwanda
-
 Saudi Arabia
-
 Serbia
-
 Singapore
-
 Slovakia
-
 Slovenia
-
 Somalia
-
 South Africa
-
 Spain
Spain
-
 Sri Lanka
-
 Sweden
-
 Switzerland
-
 Syria
Syria
-
 Taiwan
-
 Tajikistan
-
 Tanzania
-
 Thailand
-
 Trinidad and Tobago
-
 Tunisia
-
 Turkey
-
 UAE
UAE
-
 Uganda
-
 Ukraine
-
 United Kingdom
-
United States
-
 Uruguay
-
 Uzbekistan
-
 Venezuela
-
 Vietnam
-
 Yemen
Yemen
-
 Zambia
-
 Zimbabwe
- Forex
- Crypto












