

Advanced Energy shares drop about 4.5% after opening a downside gap amid mixed momentum signals

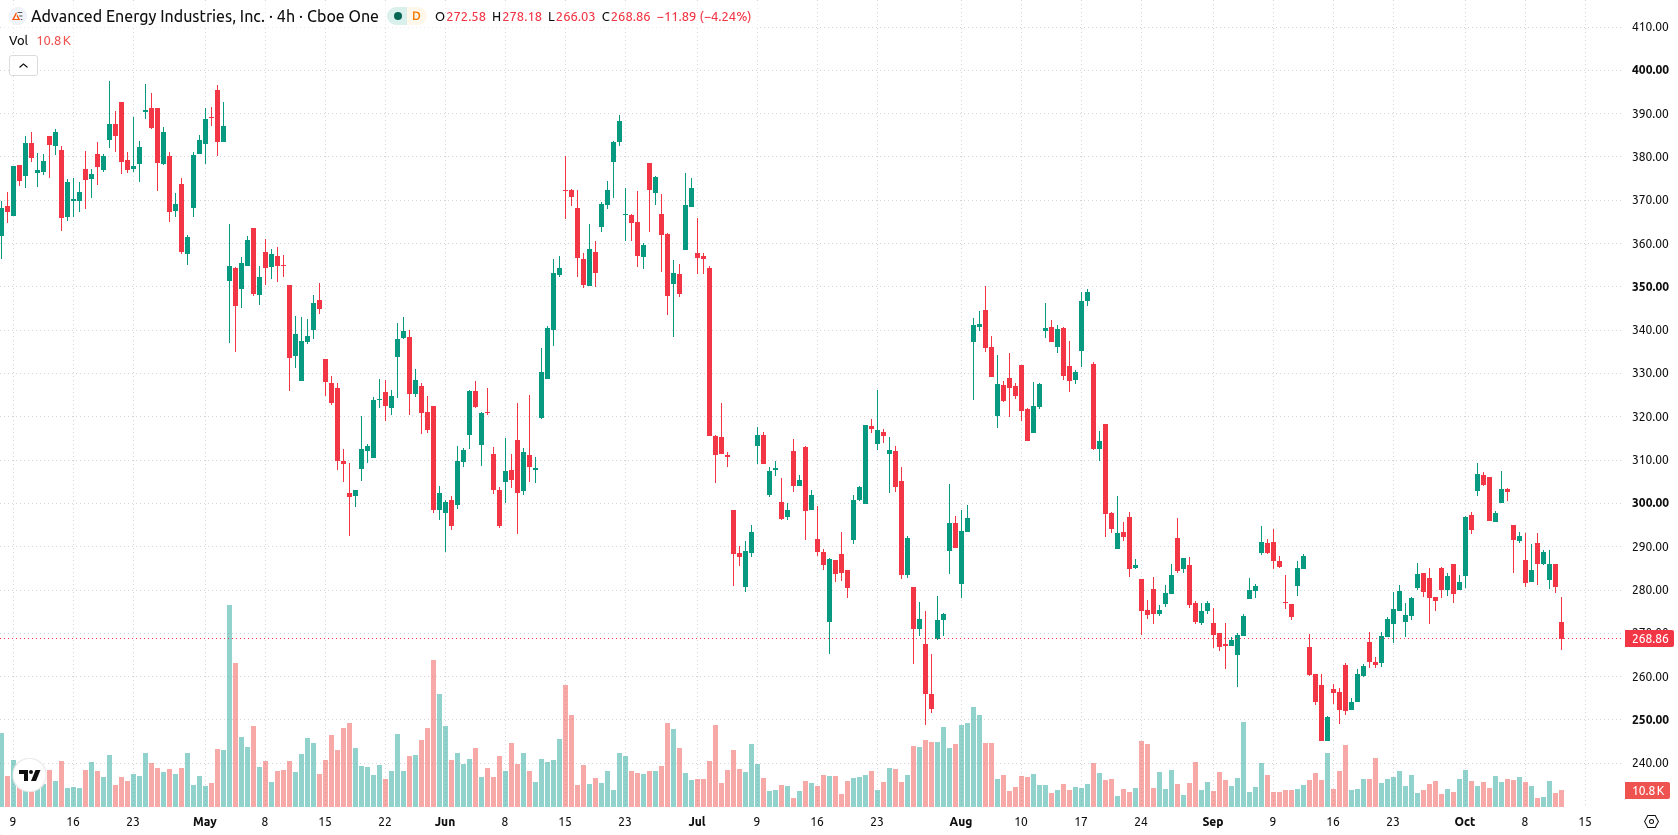
Advanced Energy Industries, Inc. (AEIS) fell 4.53% as persistent downside pressure and a clear bearish trend dominate the technical backdrop, with the price sharply declining after a downside gap on the open. The move is supported by the stock trading below its 20-day, 50-day, and 200-day moving averages, while mixed momentum signals and oversold readings restrict further immediate declines.
 247.41
289.19
247.41
289.19
Highlights
- Shares of Advanced Energy are trading below short and long-term moving averages, indicating sustained downside pressure and a broadly bearish trend.
- Intraday price action shows a 4.53% decline after a downside gap, with volatility extremely limited post-open and mixed momentum readings.
- Expected five-day price range is $252.53 to $275.1, with a 71% probability of a further downward move unless the price breaks key support or resistance.
Mixed momentum and weak trend conviction as technical barriers hold
Advanced Energy is currently trading below its 20-day ($279.05), 50-day ($290.45), and 200-day ($307.58) moving averages, indicating persistent downside pressure across all time frames. The prevailing alignment between the 50-day and 200-day averages signals a bearish long-term trend, with the nearest resistance located at $275.1 and support at $252.53. Momentum signals are mixed: the Moving Average Convergence Divergence (MACD) gives a "Buy" indication, yet the Average Directional Index (ADX) remains weak at 9.92 and neutral. The Relative Strength Index (RSI) sits at 47.84 with a "Sell" forecast, while the Stochastic RSI is at 0 and reads "Oversold," suggesting the stock may be technically stretched to the downside. The Commodity Channel Index (CCI) and Awesome Oscillator are both neutral. Bull/Bear Power (BBP) shows buyers currently in control, but warns of overbought conditions even as the price posts a sharp decline of $12.71 (down 4.53%) after opening with a downside gap of about $4.56, or 1.62%. With both the session high and low at $276.18 and intraday volatility at 0.00%, the price action reflects notable pressure immediately after the open without further range development. Diverging momentum readings underscore shaky intraday conviction.
Earlier, analysts noted that Advanced Energy faced persistent downside pressure, with mixed technical signals limiting the possibility of a sustained recovery. The current article reinforces this bearish outlook with all key moving averages trending lower, highlighting $252.53 as a critical support level to watch should downside risks continue to unfold.





Latest Advanced Energy News






-
 Afghanistan
-
 Albania
-
 Algeria
-
 Angola
-
 Argentina
-
 Armenia
-
 Australia
-
 Austria
-
 Azerbaijan
-
 Bahamas
-
 Bahrain
-
 Bangladesh
-
 Belarus
-
 Belgium
-
 Bolivia
-
 Botswana
-
 Brazil
-
 Brunei
-
 Bulgaria
-
 Cambodia
-
 Cameroon
-
 Canada
-
 Chile
Chile
-
 China
China
-
 Colombia
-
 Congo
Congo
-
 Costa Rica
-
 Cote d'Ivoire
-
 Croatia
-
 Cuba
Cuba
-
 Cyprus
-
 Czechia
-
 DR Congo
-
 Denmark
-
 Dominican Republic
-
 Ecuador
-
 Egypt
Egypt
-
 El Salvador
-
 Estonia
-
 Eswatini
-
 Ethiopia
-
 Finland
-
 France
-
 Georgia
-
 Germany
-
 Ghana
Ghana
-
 Greece
-
 Haiti
Haiti
-
 Hong Kong
-
 Hungary
-
 India
India
-
 Indonesia
-
 Iran, Islamic republic
-
 Iraq
Iraq
-
 Ireland
-
 Israel
-
 Italy
Italy
-
 Jamaica
-
 Japan
Japan
-
 Jordan
-
 Kazakhstan
-
 Kenya
Kenya
-
 Korea
Korea
-
 Kuwait
-
 Kyrgyzstan
-
 Laos
Laos
-
 Latvia
-
 Lebanon
-
 Lesotho
-
 Libya
Libya
-
 Lithuania
-
 Luxembourg
-
 Madagascar
-
 Malaysia
-
 Malta
Malta
-
 Mauritius
-
 Mexico
-
 Moldova
-
 Mongolia
-
 Montenegro
-
 Morocco
-
 Mozambique
-
 Myanmar
-
 Namibia
-
 Nepal
Nepal
-
 Netherlands
-
 New Zealand
-
 Nigeria
-
 North Macedonia
-
 Norway
-
 Oman
Oman
-
 Pakistan
-
 Palestine
-
 Panama
-
 Papua New Guinea
-
 Paraguay
-
 Peru
Peru
-
 Philippines
-
 Poland
-
 Portugal
-
 Puerto Rico
-
 Qatar
Qatar
-
 Reunion
-
 Romania
-
 Rwanda
-
 Saudi Arabia
-
 Serbia
-
 Singapore
-
 Slovakia
-
 Slovenia
-
 Somalia
-
 South Africa
-
 Spain
Spain
-
 Sri Lanka
-
 Sweden
-
 Switzerland
-
 Syria
Syria
-
 Taiwan
-
 Tajikistan
-
 Tanzania
-
 Thailand
-
 Trinidad and Tobago
-
 Tunisia
-
 Turkey
-
 UAE
UAE
-
 Uganda
-
 Ukraine
-
 United Kingdom
-
United States
-
 Uruguay
-
 Uzbekistan
-
 Venezuela
-
 Vietnam
-
 Yemen
Yemen
-
 Zambia
-
 Zimbabwe
- Forex
- Crypto












