

Nvidia shares face pressure amid nearly 2% weekly slide as buyers watch for stabilization: weekly analysis

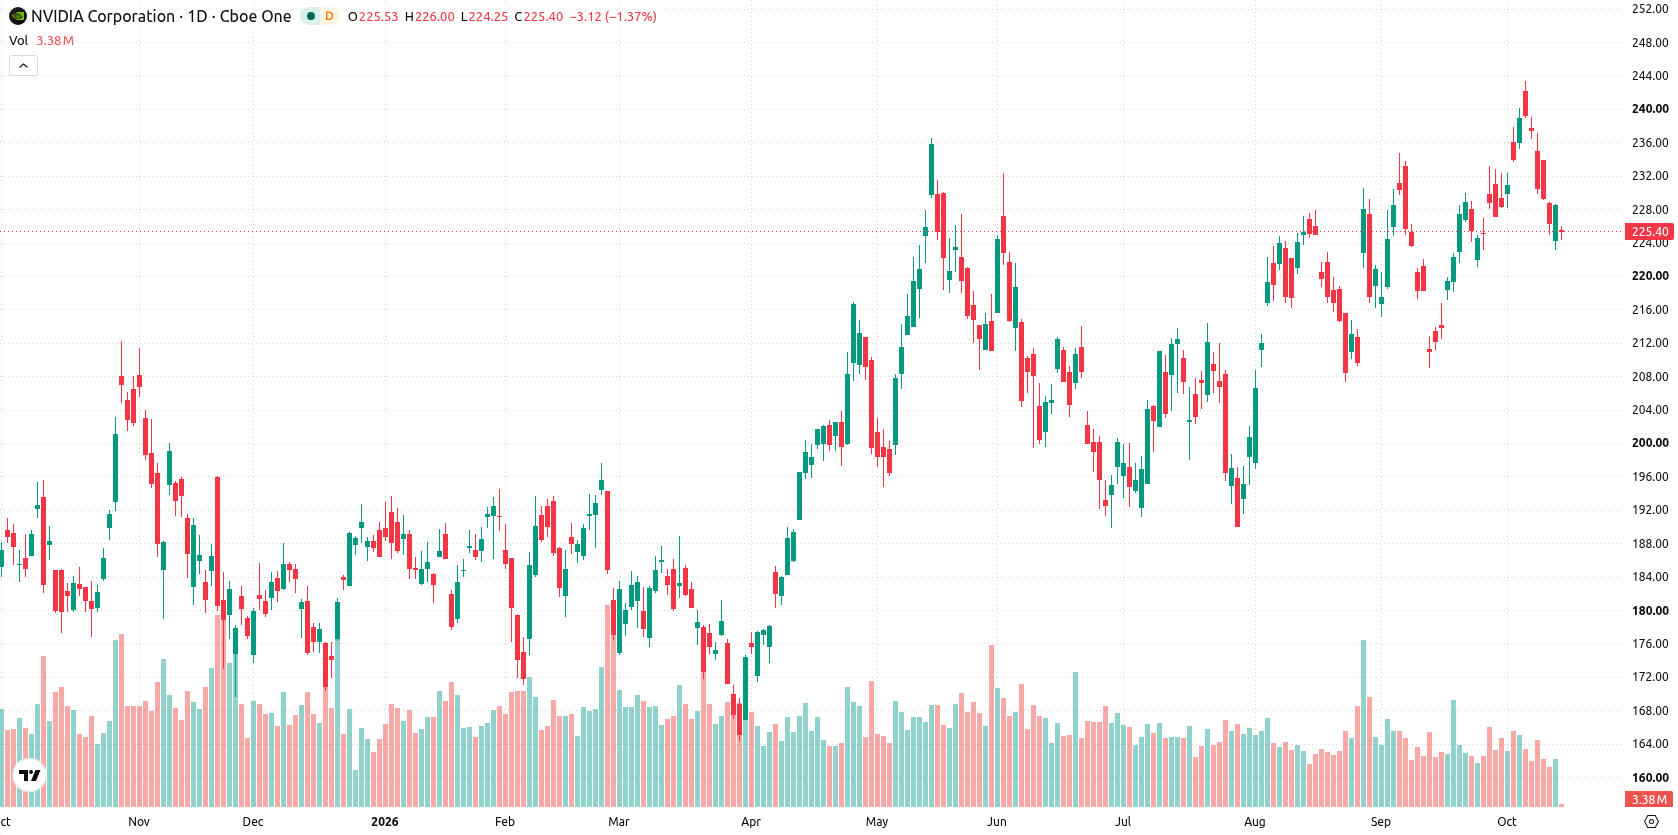
Shares of Nvidia Corporation (NVDA) are trading near $224 after falling nearly 2% over the past week. The chart shows a contained but stretched decline, with oversold signals vying for attention as the bulls look for signs of stabilization. Traders are watching closely as support comes into focus, with a potential rebound scenario setting up for the week ahead.
 228.63
237.05
228.63
237.05
Highlights
- Shares of Nvidia declined 1.77% over the past week, trading at $224.47 with a neutral-to-cautious short-term outlook.
- The stock is consolidating in a narrow range with volatility at 5.68% and support at $224.3 holding firm.
- Over the next five days, Nvidia shares are forecast to trade between $218.76 and $230.17, with a high probability of a rebound from oversold conditions.
Buyback expansion meets soft AI demand as fundamentals and sentiment diverge
Nvidia announced a $150 billion increase to its stock buyback authorization on October 12, 2026, raising the total to $235 billion — a move widely interpreted as a strong signal of management's confidence in future cash flow, according to GuruFocus. At the same time, Yahoo Finance and Seeking Alpha reported that this expanded program, along with dividends, will absorb a large share of NVDA's free cash flow, partly funded by debt. Shares of NVDA and other AI-related stocks declined after a Financial Times report cited lower-than-expected annualized revenue for OpenAI, leading to a significant drop in market value according to CNBC. NVDA also unveiled new AI architecture and expanded key partnerships at the OCP Global Summit.
Oversold momentum emerges as MACD buy bias offsets consolidation risk
On the daily chart, price action reflects a contained move within a narrow range, with volatility over the past 7 days at 5.68%. The MACD shows a buy bias with a value of 3.2, while Stochastic RSI sits deep in oversold territory at 14.05, suggesting the recent weakness may be overextended. Immediate support is firmly in play at $224.3, with resistance at $226.55 from the Ichimoku Kijun. These conditions point to consolidation, but oversold momentum signals hint at the potential for a near-term rebound.
Upside favored in the coming week as range support anchors forecasts
Over the next five trading days, the stock is forecast to trade between $218.76 and $230.17. There is a very high probability (more than 80%) of an increase and a very low probability (less than 20%) of a decrease. The base case is for consolidation inside this range, anchored by support at $224.3. A break above $226.55 would open potential towards the upper boundary, while a sustained move below $224.3 could see shares retest the lower end of the forecast range.
Previously it was reported that Nvidia partnered with the London Stock Exchange Group to accelerate financial data analysis using advanced computing technology. With the stock now at a technical inflection point and market volatility heightened, traders should closely monitor the $226.55 resistance level, as a confirmed breakout could signal the start of a new upside phase within the defined trading range.





Latest NVIDIA News





-
 Afghanistan
-
 Albania
-
 Algeria
-
 Angola
-
 Argentina
-
 Armenia
-
 Australia
-
 Austria
-
 Azerbaijan
-
 Bahamas
-
 Bahrain
-
 Bangladesh
-
 Belarus
-
 Belgium
-
 Bolivia
-
 Botswana
-
 Brazil
-
 Brunei
-
 Bulgaria
-
 Cambodia
-
 Cameroon
-
 Canada
-
 Chile
Chile
-
 China
China
-
 Colombia
-
 Congo
Congo
-
 Costa Rica
-
 Cote d'Ivoire
-
 Croatia
-
 Cuba
Cuba
-
 Cyprus
-
 Czechia
-
 DR Congo
-
 Denmark
-
 Dominican Republic
-
 Ecuador
-
 Egypt
Egypt
-
 El Salvador
-
 Estonia
-
 Eswatini
-
 Ethiopia
-
 Finland
-
 France
-
 Georgia
-
 Germany
-
 Ghana
Ghana
-
 Greece
-
 Haiti
Haiti
-
 Hong Kong
-
 Hungary
-
 India
India
-
 Indonesia
-
 Iran, Islamic republic
-
 Iraq
Iraq
-
 Ireland
-
 Israel
-
 Italy
Italy
-
 Jamaica
-
 Japan
Japan
-
 Jordan
-
 Kazakhstan
-
 Kenya
Kenya
-
 Korea
Korea
-
 Kuwait
-
 Kyrgyzstan
-
 Laos
Laos
-
 Latvia
-
 Lebanon
-
 Lesotho
-
 Libya
Libya
-
 Lithuania
-
 Luxembourg
-
 Madagascar
-
 Malaysia
-
 Malta
Malta
-
 Mauritius
-
 Mexico
-
 Moldova
-
 Mongolia
-
 Montenegro
-
 Morocco
-
 Mozambique
-
 Myanmar
-
 Namibia
-
 Nepal
Nepal
-
 Netherlands
-
 New Zealand
-
 Nigeria
-
 North Macedonia
-
 Norway
-
 Oman
Oman
-
 Pakistan
-
 Palestine
-
 Panama
-
 Papua New Guinea
-
 Paraguay
-
 Peru
Peru
-
 Philippines
-
 Poland
-
 Portugal
-
 Puerto Rico
-
 Qatar
Qatar
-
 Reunion
-
 Romania
-
 Rwanda
-
 Saudi Arabia
-
 Serbia
-
 Singapore
-
 Slovakia
-
 Slovenia
-
 Somalia
-
 South Africa
-
 Spain
Spain
-
 Sri Lanka
-
 Sweden
-
 Switzerland
-
 Syria
Syria
-
 Taiwan
-
 Tajikistan
-
 Tanzania
-
 Thailand
-
 Trinidad and Tobago
-
 Tunisia
-
 Turkey
-
 UAE
UAE
-
 Uganda
-
 Ukraine
-
 United Kingdom
-
United States
-
 Uruguay
-
 Uzbekistan
-
 Venezuela
-
 Vietnam
-
 Yemen
Yemen
-
 Zambia
-
 Zimbabwe
- Forex
- Crypto












