

Goldman Sachs stock weekly forecast: resistance at $912.09 caps recovery attempts

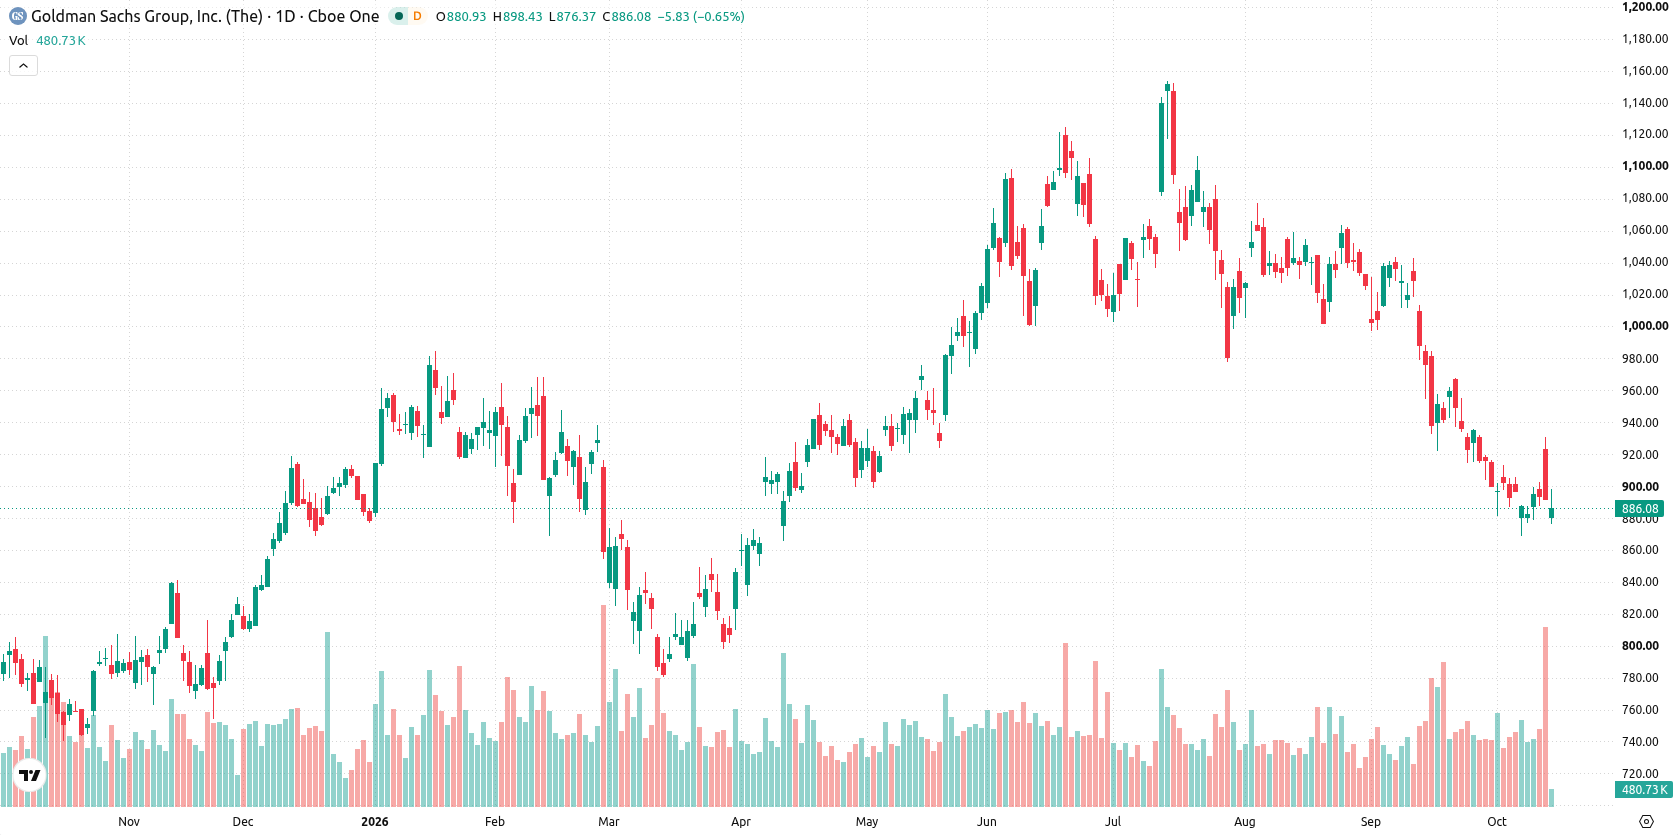
Shares of Goldman Sachs Group, Inc. (GS) are trading near $884 after slipping more than 1% over the past week, as a decline stretches into oversold territory. The robust Q3 earnings and continued industry leadership failed to stem recent pressure, leaving traders to watch if downward momentum will persist through the coming week.
 907.36
912.09
907.36
912.09
Highlights
- Shares of Goldman Sachs fell 1.13% over the past 7 days, trading at $883.76 and remaining below key moving averages.
- Technical indicators issue sustained sell signals with elevated volatility and a firm short-term downtrend.
- The coming week projects a range of $799.27 to $899.27, with a break below $877.39 likely leading to deeper losses.
Record revenues and surging equities trading buoy long-term sentiment
Goldman reported its second-highest ever quarterly revenue at $18.68 billion for Q3 2026, with earnings per share of $17.01, beating analyst expectations, according to CNBC and Yahoo Finance. The company’s equities trading revenue surged 72% year over year to $6.44 billion, while advisory fees hit a record as M&A activity rebounded (sources: Benzinga, 24/7 Wall St.). A $5.00 dividend was declared and $4.49 billion was returned to shareholders through buybacks and dividends during the quarter (sources: Alphastreet, Yahoo Finance).
Bearish momentum persists as MACD and RSI warn of further downside
The daily chart shows a trending environment with a sustained move lower and a firm trend, as MACD issues a strong sell signal and RSI sits at 34.5, approaching the oversold zone. Volatility remains elevated over the week at 3.95%. The nearest support is at $877.39, with resistance at $912.09 and the Ichimoku Kijun at $954.32 acting as an additional resistance. This setup points to ongoing bearish momentum, with pressure concentrated near support.
Downside favored in the coming week unless support gives way
For the coming trading week, the expected range is $799.27 to $899.27. There is a very low probability (less than 20%) of an increase and a very high probability (more than 80%) of a decrease. The base case is for the stock to remain pressured inside the range, with further downside likely if support at $877.39 fails. A bullish scenario would require a move above $912.09 to open up room for recovery, while a break below $877.39 would clear the way for deeper losses toward the lower boundary of the projected range.
Earlier, analysts noted that Goldman Sachs was expanding its presence across Asia to tap into opportunities from rising AI infrastructure investment and increased capital markets activity in the region. The current price action highlights downside risk as shares approach key support levels, making the $877.39 mark critical to monitor for potential trend continuation or reversal in the coming sessions.




Latest Goldman Sachs News






-
 Afghanistan
-
 Albania
-
 Algeria
-
 Angola
-
 Argentina
-
 Armenia
-
 Australia
-
 Austria
-
 Azerbaijan
-
 Bahamas
-
 Bahrain
-
 Bangladesh
-
 Belarus
-
 Belgium
-
 Bolivia
-
 Botswana
-
 Brazil
-
 Brunei
-
 Bulgaria
-
 Cambodia
-
 Cameroon
-
 Canada
-
 Chile
Chile
-
 China
China
-
 Colombia
-
 Congo
Congo
-
 Costa Rica
-
 Cote d'Ivoire
-
 Croatia
-
 Cuba
Cuba
-
 Cyprus
-
 Czechia
-
 DR Congo
-
 Denmark
-
 Dominican Republic
-
 Ecuador
-
 Egypt
Egypt
-
 El Salvador
-
 Estonia
-
 Eswatini
-
 Ethiopia
-
 Finland
-
 France
-
 Georgia
-
 Germany
-
 Ghana
Ghana
-
 Greece
-
 Haiti
Haiti
-
 Hong Kong
-
 Hungary
-
 India
India
-
 Indonesia
-
 Iran, Islamic republic
-
 Iraq
Iraq
-
 Ireland
-
 Israel
-
 Italy
Italy
-
 Jamaica
-
 Japan
Japan
-
 Jordan
-
 Kazakhstan
-
 Kenya
Kenya
-
 Korea
Korea
-
 Kuwait
-
 Kyrgyzstan
-
 Laos
Laos
-
 Latvia
-
 Lebanon
-
 Lesotho
-
 Libya
Libya
-
 Lithuania
-
 Luxembourg
-
 Madagascar
-
 Malaysia
-
 Malta
Malta
-
 Mauritius
-
 Mexico
-
 Moldova
-
 Mongolia
-
 Montenegro
-
 Morocco
-
 Mozambique
-
 Myanmar
-
 Namibia
-
 Nepal
Nepal
-
 Netherlands
-
 New Zealand
-
 Nigeria
-
 North Macedonia
-
 Norway
-
 Oman
Oman
-
 Pakistan
-
 Palestine
-
 Panama
-
 Papua New Guinea
-
 Paraguay
-
 Peru
Peru
-
 Philippines
-
 Poland
-
 Portugal
-
 Puerto Rico
-
 Qatar
Qatar
-
 Reunion
-
 Romania
-
 Rwanda
-
 Saudi Arabia
-
 Serbia
-
 Singapore
-
 Slovakia
-
 Slovenia
-
 Somalia
-
 South Africa
-
 Spain
Spain
-
 Sri Lanka
-
 Sweden
-
 Switzerland
-
 Syria
Syria
-
 Taiwan
-
 Tajikistan
-
 Tanzania
-
 Thailand
-
 Trinidad and Tobago
-
 Tunisia
-
 Turkey
-
 UAE
UAE
-
 Uganda
-
 Ukraine
-
 United Kingdom
-
United States
-
 Uruguay
-
 Uzbekistan
-
 Venezuela
-
 Vietnam
-
 Yemen
Yemen
-
 Zambia
-
 Zimbabwe
- Forex
- Crypto












