

What's behind Delta Air Lines's latest 3.4% stock pullback?

Delta Air Lines Inc (DAL) slumped 3.43% after a combination of delayed route expansion and a cut to profit guidance raised fresh concerns about operational and cost headwinds. The down move is supported by a decisive slip below short- and medium-term moving averages, with sellers pressing the price near long-term support.
 78.95
81.70
78.95
81.70
Highlights
- Delta Air Lines delayed its planned Atlanta to Riyadh route to March 2027, citing safety concerns near Riyadh airport.
- The company reduced its full-year and 2026 profit outlook due to $6 billion in higher jet fuel costs.
- Shares of Delta Air Lines are under short- and medium-term selling pressure and are projected to trade between $74.69 and $78.97 over the coming week.
Jet fuel cost surge and Middle East safety risks prompt guidance cut
Delta Air Lines postponed the launch of its planned direct Atlanta to Riyadh service, originally expected in October 2026, to March 2027 due to safety concerns following reported Houthi attacks near Riyadh airport and related warnings from the FAA. The airline also lowered its full-year and 2026 profit outlook as rising jet fuel costs added $6 billion in expenses, countering strong momentum in premium ticket and American Express-related revenues. On October 9, $27.3 million in net ETF outflows from DAL shares was reported, though price action has remained under broader selling pressure.
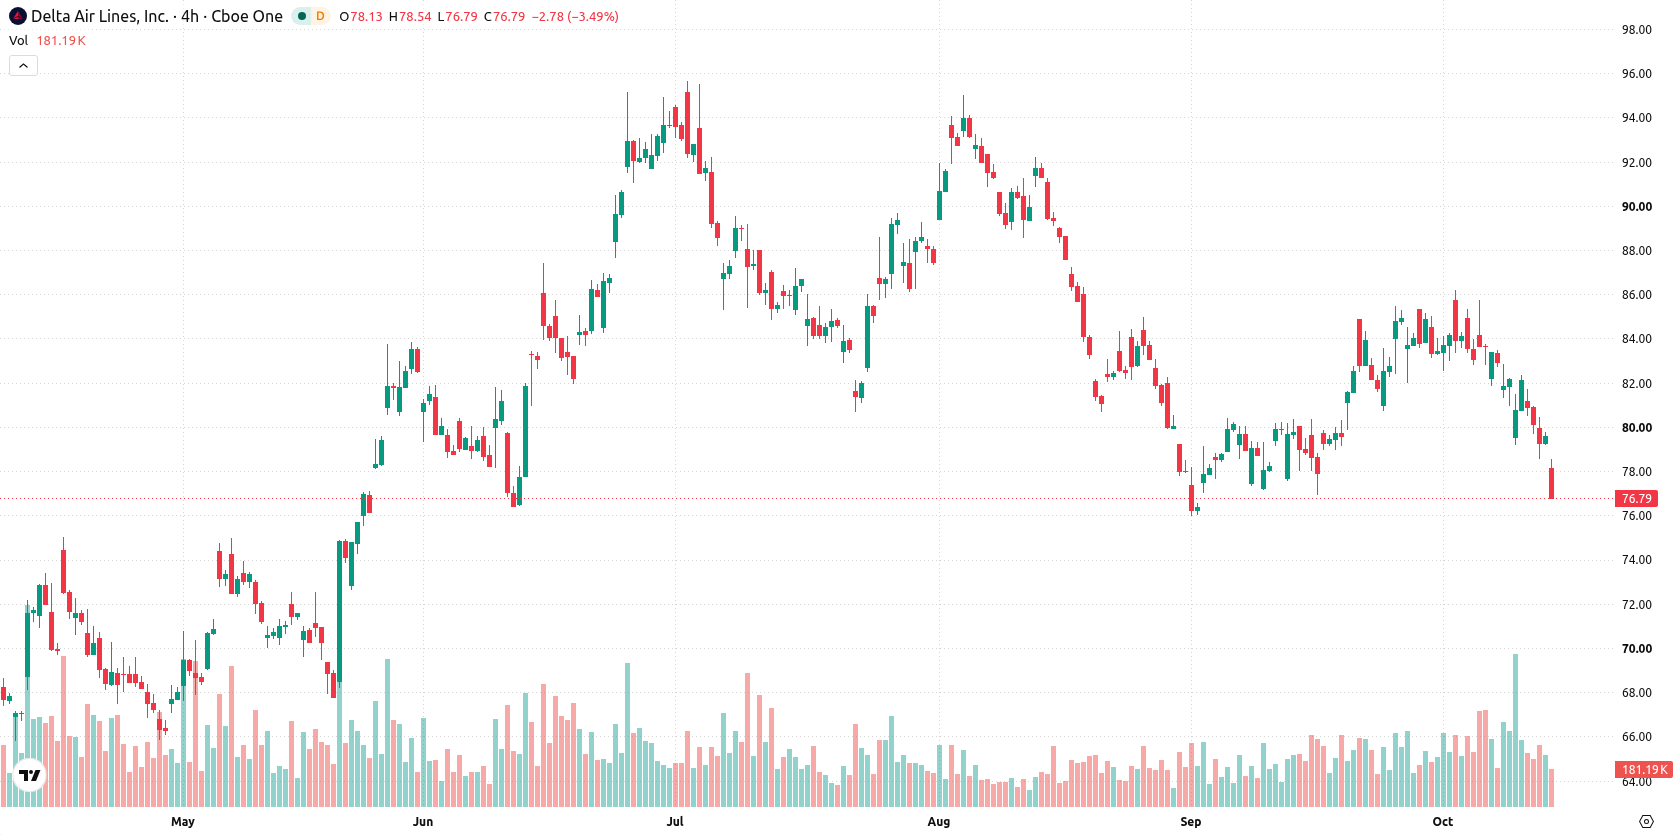
Downside momentum intensifies as oversold signals cluster near 200-day support
Delta Air Lines has slipped below its 20-day and 50-day moving averages at $82.36 and $83.26, but remains just above its 200-day moving average at $76.19. This setup signals short- and medium-term pressure from sellers, with the long-term bullish structure still intact; immediate support is seen at the 200-day moving average and resistance at today's low of $78.56. Momentum signals show weakness, with the Relative Strength Index (RSI) at 40.08 forecasting a "Sell" and the Stochastic RSI, Commodity Channel Index (CCI), and Bull/Bear Power (BBP) all indicating oversold conditions. Sellers dominate intraday momentum as reflected by BBP at -1.32, with the Awesome Oscillator providing a neutral view. The stock is down $2.73, or 3.43%, trading at $76.83 after an upside gap of about $1.14 (1.43%) and is positioned near its intraday low. Intraday volatility stands at 2.72%, and the tone points to pressure after the open. Weak momentum readings are consistent with the stock's sharp pullback.
Previously it was reported that Delta Air Lines faced short-term selling pressure despite underlying signs of operational and technical strength. The latest developments introduce fresh operational risks and reinforce downside momentum, making sustained support at the 200-day moving average a key level to monitor in the days ahead.





Latest Delta Air Lines News





-
 Afghanistan
-
 Albania
-
 Algeria
-
 Angola
-
 Argentina
-
 Armenia
-
 Australia
-
 Austria
-
 Azerbaijan
-
 Bahamas
-
 Bahrain
-
 Bangladesh
-
 Belarus
-
 Belgium
-
 Bolivia
-
 Botswana
-
 Brazil
-
 Brunei
-
 Bulgaria
-
 Cambodia
-
 Cameroon
-
 Canada
-
 Chile
Chile
-
 China
China
-
 Colombia
-
 Congo
Congo
-
 Costa Rica
-
 Cote d'Ivoire
-
 Croatia
-
 Cuba
Cuba
-
 Cyprus
-
 Czechia
-
 DR Congo
-
 Denmark
-
 Dominican Republic
-
 Ecuador
-
 Egypt
Egypt
-
 El Salvador
-
 Estonia
-
 Eswatini
-
 Ethiopia
-
 Finland
-
 France
-
 Georgia
-
 Germany
-
 Ghana
Ghana
-
 Greece
-
 Haiti
Haiti
-
 Hong Kong
-
 Hungary
-
 India
India
-
 Indonesia
-
 Iran, Islamic republic
-
 Iraq
Iraq
-
 Ireland
-
 Israel
-
 Italy
Italy
-
 Jamaica
-
 Japan
Japan
-
 Jordan
-
 Kazakhstan
-
 Kenya
Kenya
-
 Korea
Korea
-
 Kuwait
-
 Kyrgyzstan
-
 Laos
Laos
-
 Latvia
-
 Lebanon
-
 Lesotho
-
 Libya
Libya
-
 Lithuania
-
 Luxembourg
-
 Madagascar
-
 Malaysia
-
 Malta
Malta
-
 Mauritius
-
 Mexico
-
 Moldova
-
 Mongolia
-
 Montenegro
-
 Morocco
-
 Mozambique
-
 Myanmar
-
 Namibia
-
 Nepal
Nepal
-
 Netherlands
-
 New Zealand
-
 Nigeria
-
 North Macedonia
-
 Norway
-
 Oman
Oman
-
 Pakistan
-
 Palestine
-
 Panama
-
 Papua New Guinea
-
 Paraguay
-
 Peru
Peru
-
 Philippines
-
 Poland
-
 Portugal
-
 Puerto Rico
-
 Qatar
Qatar
-
 Reunion
-
 Romania
-
 Rwanda
-
 Saudi Arabia
-
 Serbia
-
 Singapore
-
 Slovakia
-
 Slovenia
-
 Somalia
-
 South Africa
-
 Spain
Spain
-
 Sri Lanka
-
 Sweden
-
 Switzerland
-
 Syria
Syria
-
 Taiwan
-
 Tajikistan
-
 Tanzania
-
 Thailand
-
 Trinidad and Tobago
-
 Tunisia
-
 Turkey
-
 UAE
UAE
-
 Uganda
-
 Ukraine
-
 United Kingdom
-
United States
-
 Uruguay
-
 Uzbekistan
-
 Venezuela
-
 Vietnam
-
 Yemen
Yemen
-
 Zambia
-
 Zimbabwe
- Forex
- Crypto












