

Can Robinhood earnings report pressure Robinhood stock?

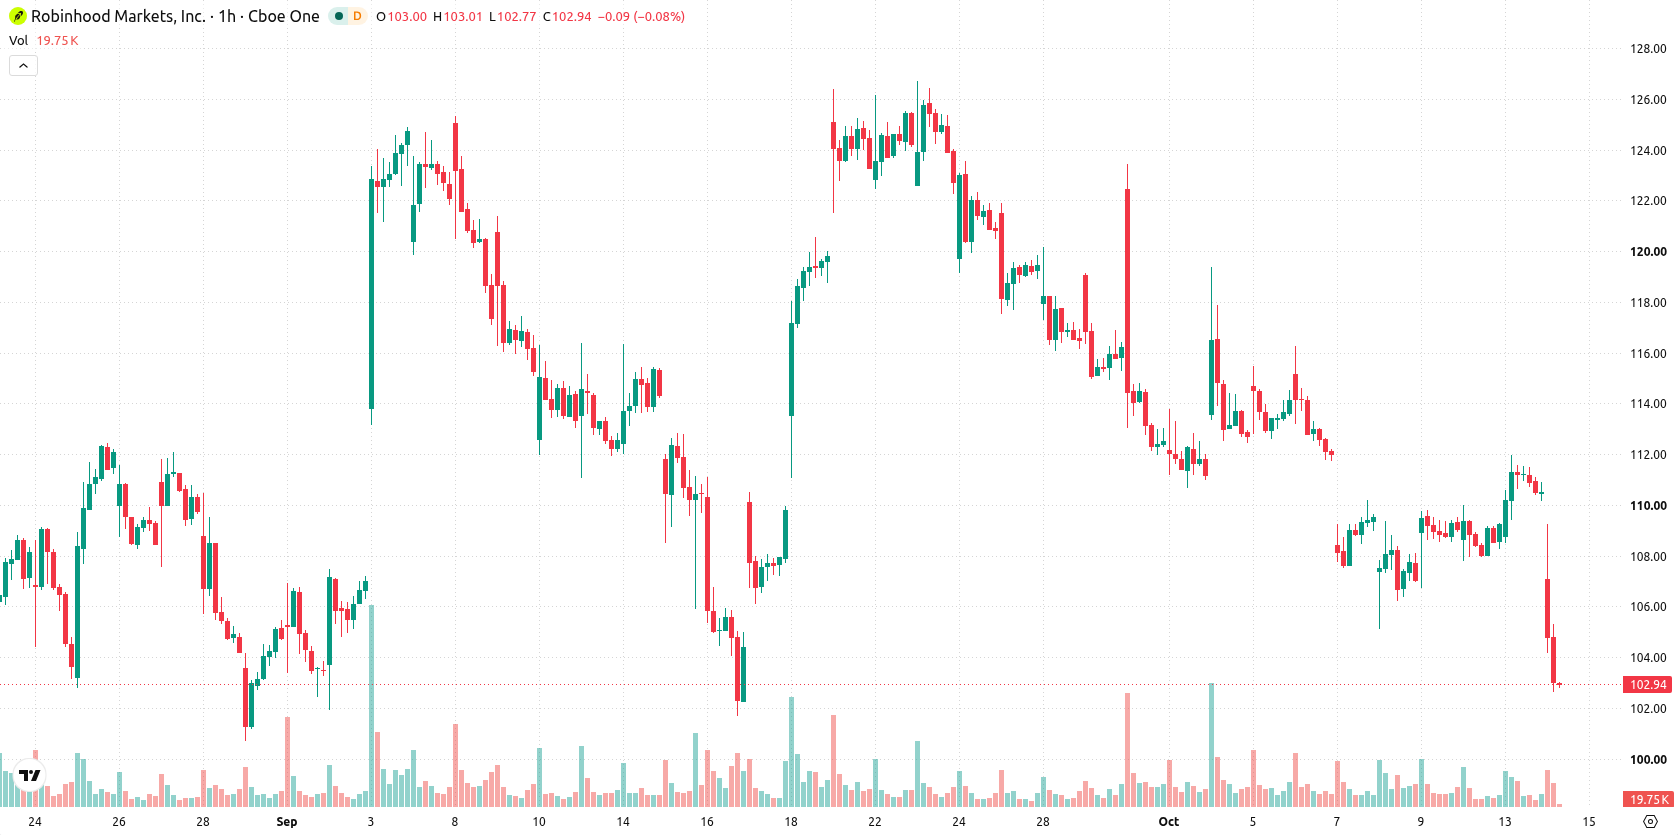
Robinhood (HOOD) stock is trading at $102.94, reflecting a 6.93% decline for the day. The price now sits below its key moving averages, indicating a sharp intraday reversal amid high volatility.
 83.32
88.71
Highlights
- Robinhood stock faces elevated volatility as investors remain cautious ahead of its scheduled October 27, 2026 earnings report.
- Short-term market positioning is shifting, with near-term uncertainty affecting exposure to Robinhood shares.
- Shares trade below short- and medium-term trend levels, with price down 6.93% and a probable range of $100.04 to $112.02 indicated.
Earnings uncertainty fuels investor caution and market repositioning
Robinhood Markets Inc is scheduled to release its earnings report on October 27, 2026, according to Yahoo Finance. The upcoming announcement is prompting investor caution, as participants reassess their short-term exposure with earnings uncertainty on the horizon. Heightened anticipation ahead of this event is increasing intraday volatility and may be prompting repositioning across the market.
Momentum divergence as mixed signals clash at resistance
On the h1 timeframe, HOOD is positioned below both the MA-20 at $109.49 and the MA-50 at $110.27, while remaining above the long-term MA-200 set at $94. Immediate resistance is defined by the Ichimoku Kijun at $108.91. The MACD issues a Buy signal, accompanied by a Neutral stance from the ADX, while the RSI and CCI both register Buy. Stochastic RSI stands Neutral, Bull/Bear Power signals overbought dynamics indicating intraday buyer dominance, and the Awesome Oscillator supports prevailing upward momentum. However, mixed oscillator readings persist, signaling divergence between short-term momentum and ongoing price movement.
Downside risk looms as consolidation holds within support band
In the immediate term, HOOD is expected to fluctuate within a $100.04 to $112.02 band, consistent with current volatility. Scenario probability leans heavily toward further downside, with a 76% chance of a drop and only a 24% likelihood of a rebound. The baseline outlook anticipates price consolidation inside the $100 to $112 corridor, while a decisive move above $108.91 could trigger a bullish sequence; conversely, a breakdown below $100 support would open the way for further weakness.
Earlier, analysts noted that Robinhood and key retail trading partners are driving innovation in targeted market products while emphasizing the importance of investor education. In light of recent price action and technical signals, continued volatility around the $100 support level presents a critical inflection point for traders ahead of the upcoming earnings announcement.











-
 Afghanistan
-
 Albania
-
 Algeria
-
 Angola
-
 Argentina
-
 Armenia
-
 Australia
-
 Austria
-
 Azerbaijan
-
 Bahamas
-
 Bahrain
-
 Bangladesh
-
 Belarus
-
 Belgium
-
 Bolivia
-
 Botswana
-
 Brazil
-
 Brunei
-
 Bulgaria
-
 Cambodia
-
 Cameroon
-
 Canada
-
 Chile
-
 China
-
 Colombia
-
 Congo
-
 Costa Rica
-
 Cote d'Ivoire
-
 Croatia
-
 Cuba
-
 Cyprus
-
 Czechia
-
 DR Congo
-
 Denmark
-
 Dominican Republic
-
 Ecuador
-
 Egypt
-
 El Salvador
-
 Estonia
-
 Eswatini
-
 Ethiopia
-
 Finland
-
 France
-
 Georgia
-
 Germany
-
 Ghana
-
 Greece
-
 Haiti
-
 Hong Kong
-
 Hungary
-
 India
-
 Indonesia
-
 Iran, Islamic republic
-
 Iraq
-
 Ireland
-
 Israel
-
 Italy
-
 Jamaica
-
 Japan
-
 Jordan
-
 Kazakhstan
-
 Kenya
-
 Korea
-
 Kuwait
-
 Kyrgyzstan
-
 Laos
-
 Latvia
-
 Lebanon
-
 Lesotho
-
 Libya
-
 Lithuania
-
 Luxembourg
-
 Madagascar
-
 Malaysia
-
 Malta
-
 Mauritius
-
 Mexico
-
 Moldova
-
 Mongolia
-
 Montenegro
-
 Morocco
-
 Mozambique
-
 Myanmar
-
 Namibia
-
 Nepal
-
 Netherlands
-
 New Zealand
-
 Nigeria
-
 North Macedonia
-
 Norway
-
 Oman
-
 Pakistan
-
 Palestine
-
 Panama
-
 Papua New Guinea
-
 Paraguay
-
 Peru
-
 Philippines
-
 Poland
-
 Portugal
-
 Puerto Rico
-
 Qatar
-
 Reunion
-
 Romania
-
 Rwanda
-
 Saudi Arabia
-
 Serbia
-
 Singapore
-
 Slovakia
-
 Slovenia
-
 Somalia
-
 South Africa
-
 Spain
-
 Sri Lanka
-
 Sweden
-
 Switzerland
-
 Syria
-
 Taiwan
-
 Tajikistan
-
 Tanzania
-
 Thailand
-
 Trinidad and Tobago
-
 Tunisia
-
 Turkey
-
 UAE
-
 Uganda
-
 Ukraine
-
 United Kingdom
-
United States
-
 Uruguay
-
 Uzbekistan
-
 Venezuela
-
 Vietnam
-
 Yemen
-
 Zambia
-
 Zimbabwe
- Forex
- Crypto












