

Tesla shares technical analysis: Downward price move dominates as sellers remain in control

Tesla (TSLA) stock is trading at $365, showing a daily decline of 2.74% and maintaining a position below its key moving averages.
 370.50
382.41
370.50
382.41
Highlights
- Tesla has issued a new over-the-air update with FSD v14.3 Lite, increasing the feature set for both new and legacy vehicles.
- The shareholder question platform is open ahead of the Q3 2026 earnings call, and advance work is underway for the next-generation Roadster event in Waco, Texas.
- Shares of Tesla fell 2.74% to $365, remain under bearish pressure, and are expected to trade between $356.12 and $373.88 in coming days.
Feature rollout expansion as FSD update targets legacy vehicles
Tesla has released a new over-the-air software update (version 2026.38.5.1), delivering FSD v14.3 Lite and several new features to its vehicles, according to Notateslaapp. This upgrade enhances the product offering and could influence customer engagement, though its short-term price impact remains indirect. Tesla has also expanded the FSD v14.3 Lite rollout to legacy HW3 Model S and Model X vehicles with Intel Atom-based GPUs, as reported by Teslaoracle, increasing the utility of older models. Additional updates include the opening of the shareholder question box for the upcoming Q3 2026 earnings call, and preparations for the next-generation Roadster unveiling event in Waco, Texas, according to Teslanorth and TradingKey, though price action has remained under broader selling pressure.
Downside pressure persists as indicators diverge on momentum
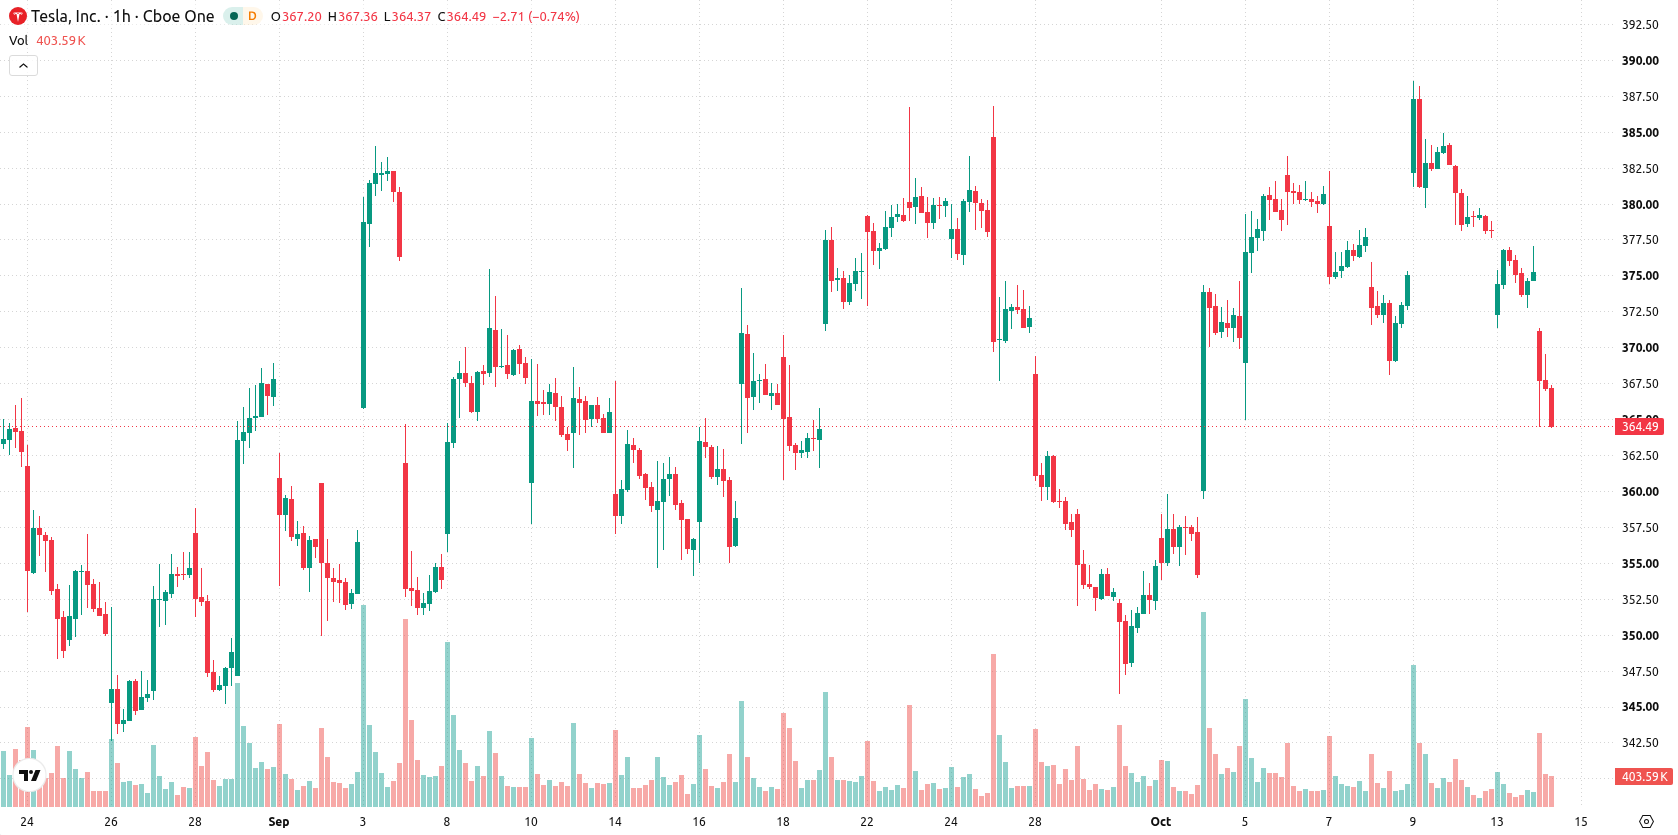
On the technical front, TSLA/USD sits below the MA-20, MA-50, and long-term MA-200 on the hourly chart. Immediate resistance is defined by the Ichimoku Kijun at $378.29. Momentum indicators remain negative: MACD and ADX signal a prevailing sell bias, RSI is at 43.14, CCI also reads Sell, and Stochastic RSI is in Oversold territory. Notably, Bull/Bear Power diverges from other oscillators, showing intraday buyer dominance, while the Awesome Oscillator is neutral and does not confirm the trend.
Limited rebound prospects as consolidation and downside risk dominate
In the near term, TSLA is expected to trade within a range of $356.12 to $373.88, reflecting a typical volatility band relative to current levels. The probability of an upward breakout above resistance is assessed as very low, while continued downside pressure appears likely. The baseline scenario is for consolidation within this corridor, with a bearish extension if support is decisively breached.
Earlier, analysts noted that Tesla's near-term performance was likely to be shaped more by macroeconomic factors and technical barriers than by product updates or new vehicle launches. The current technical setup reinforces this view, as persistent downside momentum suggests traders should monitor for a potential bearish extension if consolidation support levels are breached.











-
 Afghanistan
-
 Albania
-
 Algeria
-
 Angola
-
 Argentina
-
 Armenia
-
 Australia
-
 Austria
-
 Azerbaijan
-
 Bahamas
-
 Bahrain
-
 Bangladesh
-
 Belarus
-
 Belgium
-
 Bolivia
-
 Botswana
-
 Brazil
-
 Brunei
-
 Bulgaria
-
 Cambodia
-
 Cameroon
-
 Canada
-
 Chile
Chile
-
 China
China
-
 Colombia
-
 Congo
Congo
-
 Costa Rica
-
 Cote d'Ivoire
-
 Croatia
-
 Cuba
Cuba
-
 Cyprus
-
 Czechia
-
 DR Congo
-
 Denmark
-
 Dominican Republic
-
 Ecuador
-
 Egypt
Egypt
-
 El Salvador
-
 Estonia
-
 Eswatini
-
 Ethiopia
-
 Finland
-
 France
-
 Georgia
-
 Germany
-
 Ghana
Ghana
-
 Greece
-
 Haiti
Haiti
-
 Hong Kong
-
 Hungary
-
 India
India
-
 Indonesia
-
 Iran, Islamic republic
-
 Iraq
Iraq
-
 Ireland
-
 Israel
-
 Italy
Italy
-
 Jamaica
-
 Japan
Japan
-
 Jordan
-
 Kazakhstan
-
 Kenya
Kenya
-
 Korea
Korea
-
 Kuwait
-
 Kyrgyzstan
-
 Laos
Laos
-
 Latvia
-
 Lebanon
-
 Lesotho
-
 Libya
Libya
-
 Lithuania
-
 Luxembourg
-
 Madagascar
-
 Malaysia
-
 Malta
Malta
-
 Mauritius
-
 Mexico
-
 Moldova
-
 Mongolia
-
 Montenegro
-
 Morocco
-
 Mozambique
-
 Myanmar
-
 Namibia
-
 Nepal
Nepal
-
 Netherlands
-
 New Zealand
-
 Nigeria
-
 North Macedonia
-
 Norway
-
 Oman
Oman
-
 Pakistan
-
 Palestine
-
 Panama
-
 Papua New Guinea
-
 Paraguay
-
 Peru
Peru
-
 Philippines
-
 Poland
-
 Portugal
-
 Puerto Rico
-
 Qatar
Qatar
-
 Reunion
-
 Romania
-
 Rwanda
-
 Saudi Arabia
-
 Serbia
-
 Singapore
-
 Slovakia
-
 Slovenia
-
 Somalia
-
 South Africa
-
 Spain
Spain
-
 Sri Lanka
-
 Sweden
-
 Switzerland
-
 Syria
Syria
-
 Taiwan
-
 Tajikistan
-
 Tanzania
-
 Thailand
-
 Trinidad and Tobago
-
 Tunisia
-
 Turkey
-
 UAE
UAE
-
 Uganda
-
 Ukraine
-
 United Kingdom
-
United States
-
 Uruguay
-
 Uzbekistan
-
 Venezuela
-
 Vietnam
-
 Yemen
Yemen
-
 Zambia
-
 Zimbabwe
- Forex
- Crypto












