

Coinbase stock falls as seller pressure and weak momentum weigh on current level

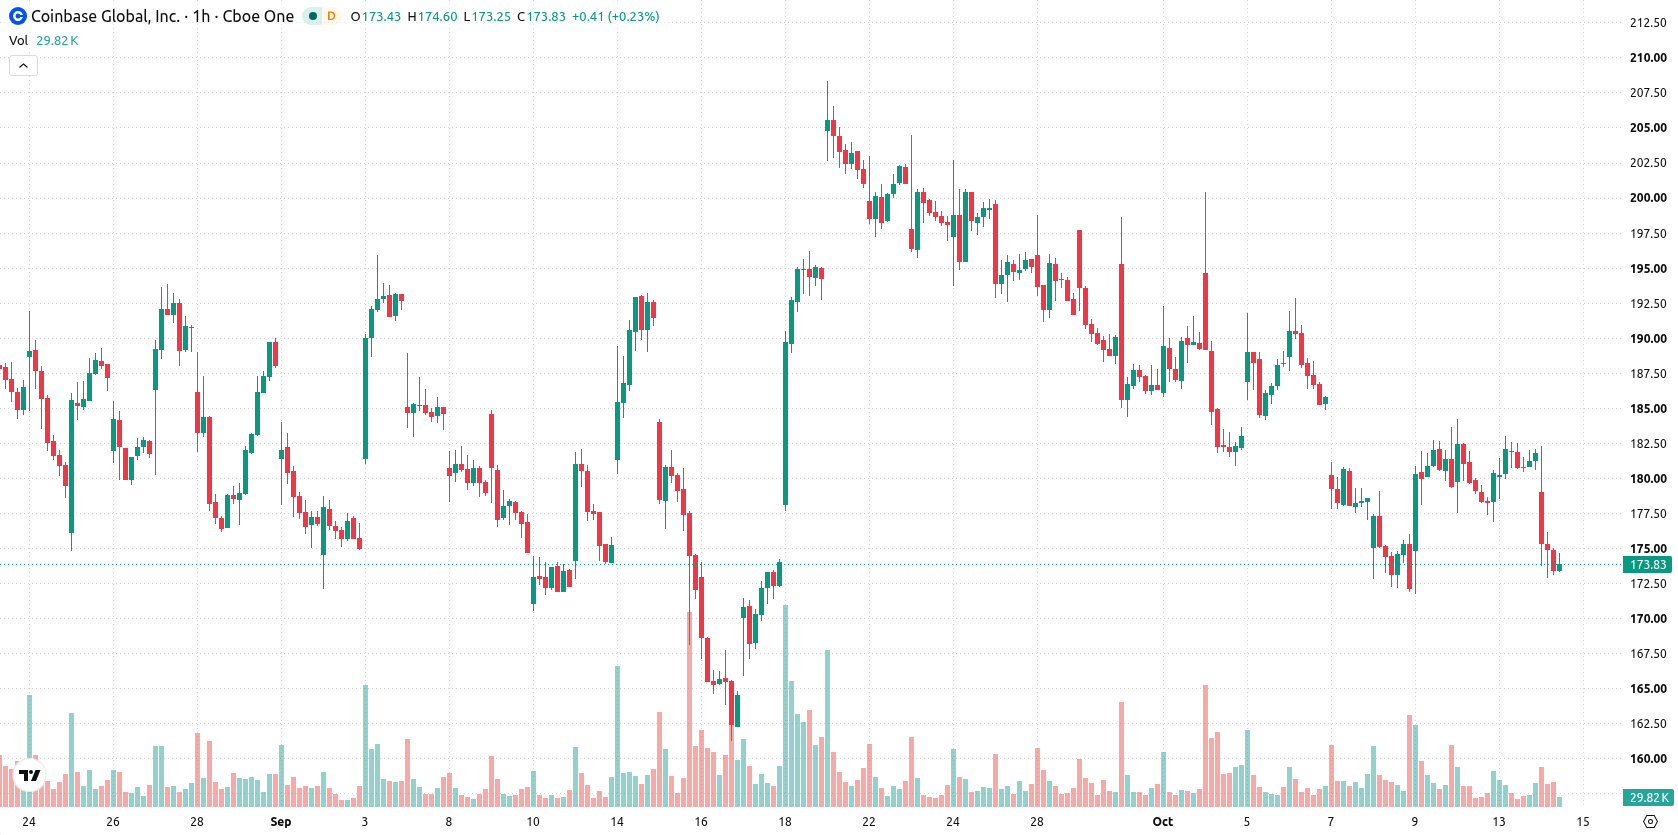
Coinbase (COIN) stock is trading at $173.88, down 4.38% for the day. The share price remains below its key moving averages, reflecting ongoing weakness following recent volatility.
 143.77
163.54
Highlights
- Coinbase released technical recommendations for Bitcoin to adopt post-quantum cryptography with phased migration and flexible wallet solutions.
- These efforts position Coinbase as a leader in digital asset security, aiming to influence future blockchain standards amid ecosystem-wide upgrade timelines.
- Shares of Coinbase closed at $173.88, down 4.38%, with technicals remaining bearish and price expected to hold between $168.40 to $179.36.
Security upgrades prioritized as Coinbase proposes quantum-proof tech
Coinbase has released a set of technical recommendations for Bitcoin’s transition to post-quantum cryptography, highlighting the importance of immediate preparations given the lengthy time frame for ecosystem-wide upgrades, according to The Block. This move demonstrates Coinbase’s leadership in blockchain security and positions the company as an active participant in shaping digital asset standards, which may affect perceptions of its technological resilience. By proposing a phased migration with flexible wallet and signature solutions, Coinbase aims to address emerging security challenges, though price action has remained under broader selling pressure.
Conflicting buy signals as momentum indicators diverge at resistance
COIN is trading beneath the MA-20 at $180.68 and the MA-50 at $181.39, as well as below the long-term MA-200 at $183.18. The Ichimoku Kijun base line stands at $177.94, currently representing immediate resistance to any potential rebound. MACD flashes a Buy signal, while ADX remains Neutral, suggesting the lack of a clear dominant trend. RSI and CCI each indicate Buy, but both Stochastic RSI and Bull/Bear Power point to overbought conditions, highlighting the risk of a short-term reversal. The Awesome Oscillator remains Neutral. This divergence across oscillators suggests a cautious stance as underlying momentum is not firmly aligned with recent declines.
Downside risk prevails as volatility range guides near-term outlook
Looking ahead, the expected price range over the next few days is $168.40 to $179.36, reflecting a volatility band relative to current levels. The base scenario anticipates COIN holding within this corridor, with a 79% probability assigned to further downside versus 21% for a recovery. A push above the immediate resistance near the Kijun would open a bullish scenario, while a break beneath support could see declines deepen.
Earlier, analysts noted that Coinbase continued to face persistent financial headwinds and sustained downside pressure in its share price. The latest developments around Coinbase's strategic initiatives in blockchain security add a layer of technological leadership, but with broad selling pressures still evident, traders should monitor for a confirmed break of the recent volatility band as a signal of the next directional move.











-
 Afghanistan
-
 Albania
-
 Algeria
-
 Angola
-
 Argentina
-
 Armenia
-
 Australia
-
 Austria
-
 Azerbaijan
-
 Bahamas
-
 Bahrain
-
 Bangladesh
-
 Belarus
-
 Belgium
-
 Bolivia
-
 Botswana
-
 Brazil
-
 Brunei
-
 Bulgaria
-
 Cambodia
-
 Cameroon
-
 Canada
-
 Chile
-
 China
-
 Colombia
-
 Congo
-
 Costa Rica
-
 Cote d'Ivoire
-
 Croatia
-
 Cuba
-
 Cyprus
-
 Czechia
-
 DR Congo
-
 Denmark
-
 Dominican Republic
-
 Ecuador
-
 Egypt
-
 El Salvador
-
 Estonia
-
 Eswatini
-
 Ethiopia
-
 Finland
-
 France
-
 Georgia
-
 Germany
-
 Ghana
-
 Greece
-
 Haiti
-
 Hong Kong
-
 Hungary
-
 India
-
 Indonesia
-
 Iran, Islamic republic
-
 Iraq
-
 Ireland
-
 Israel
-
 Italy
-
 Jamaica
-
 Japan
-
 Jordan
-
 Kazakhstan
-
 Kenya
-
 Korea
-
 Kuwait
-
 Kyrgyzstan
-
 Laos
-
 Latvia
-
 Lebanon
-
 Lesotho
-
 Libya
-
 Lithuania
-
 Luxembourg
-
 Madagascar
-
 Malaysia
-
 Malta
-
 Mauritius
-
 Mexico
-
 Moldova
-
 Mongolia
-
 Montenegro
-
 Morocco
-
 Mozambique
-
 Myanmar
-
 Namibia
-
 Nepal
-
 Netherlands
-
 New Zealand
-
 Nigeria
-
 North Macedonia
-
 Norway
-
 Oman
-
 Pakistan
-
 Palestine
-
 Panama
-
 Papua New Guinea
-
 Paraguay
-
 Peru
-
 Philippines
-
 Poland
-
 Portugal
-
 Puerto Rico
-
 Qatar
-
 Reunion
-
 Romania
-
 Rwanda
-
 Saudi Arabia
-
 Serbia
-
 Singapore
-
 Slovakia
-
 Slovenia
-
 Somalia
-
 South Africa
-
 Spain
-
 Sri Lanka
-
 Sweden
-
 Switzerland
-
 Syria
-
 Taiwan
-
 Tajikistan
-
 Tanzania
-
 Thailand
-
 Trinidad and Tobago
-
 Tunisia
-
 Turkey
-
 UAE
-
 Uganda
-
 Ukraine
-
 United Kingdom
-
United States
-
 Uruguay
-
 Uzbekistan
-
 Venezuela
-
 Vietnam
-
 Yemen
-
 Zambia
-
 Zimbabwe
- Forex
- Crypto












