

GEV slides nearly 8% as price breaks below key moving averages despite record backlog

GE Vernova Inc. (GEV) dropped 7.77% today after reporting 88% organic order growth in the second quarter, increasing its backlog and generating strong free cash flow. The selloff is supported by technical weakness, with the price falling below all major moving averages and encountering heavy short-term downside pressure.
 950.65
1005.45
950.65
1005.45
Highlights
- GE Vernova reported 88% organic order growth in its second quarter of 2026, raising backlog to $176 billion.
- The company generated more free cash flow in three months than in all of 2025, with HA turbine fleet surpassing 4 million operating hours.
- Shares of GE Vernova fell 7.77% on the day, trading below key moving averages, with forecasts indicating a high probability of short-term rebound between $876.62 and $957.09.
Backlog and cash flow surge overshadowed by ongoing pressure on shares
GE Vernova reported 88% organic order growth in the second quarter of 2026, raising its total backlog to $176 billion and generating more free cash flow in three months than in all of 2025. The company's HA turbine fleet surpassed 4 million commercial operating hours with global deployment continuing. A third quarter financial results announcement is set for October 28, 2026, though price action has remained under broader selling pressure.
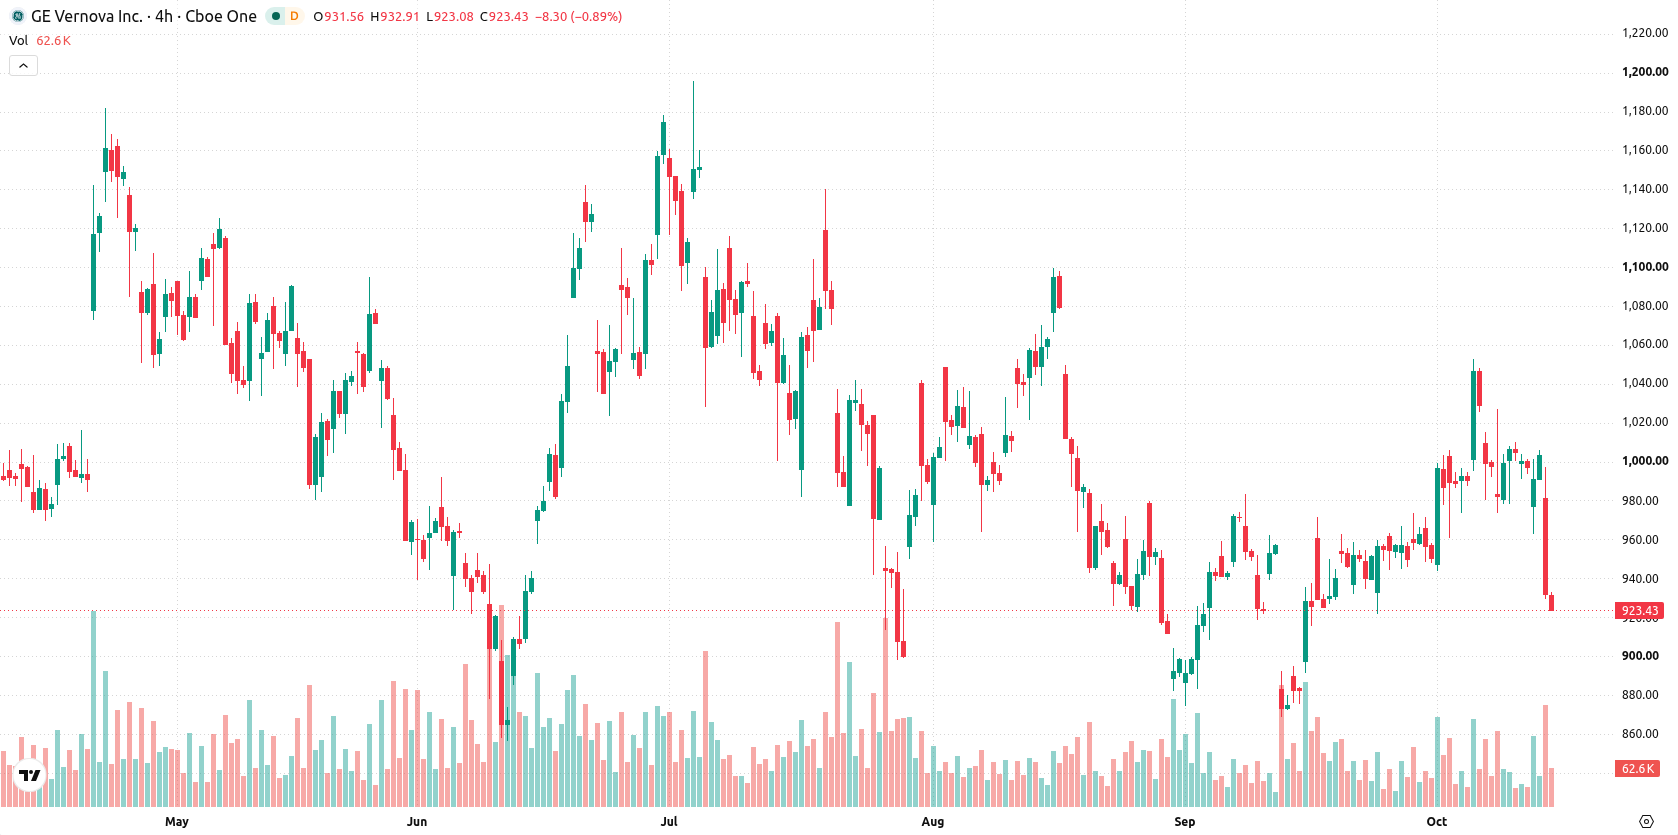
Diverging momentum and oscillators as price nears technical support
GE Vernova is trading below its 20-day, 50-day, and 200-day moving averages, with the current price under the MA-20 at $970.57, MA-50 at $968.74, and MA-200 at $929.65. This suggests downside pressure in the short and medium term, although the long-term alignment of MA-50 versus MA-200 remains bullish. The stock is close to the nearest support at $923.12, with resistance at $929.65. MACD points to continued buying momentum but the ADX at 10.86 signals a weak trend. Oscillators, including RSI, Stochastic RSI, and CCI, all show a moderate bullish bias and forecast 'Buy', while Bull/Bear Power at 18.65 warns of overbought conditions and dominant buyer activity. Elevated daily volatility at 7.25% and a heavy intraday tone reflect diverging momentum and oscillator signals compared to the price action.
Earlier, analysts noted that GE Vernova was consolidating following profit-taking, with technical signals reflecting directional uncertainty. Current technical and fundamental developments add a new dimension, indicating that traders should monitor a potential breakout above $929.65 for short-term upside or a drop below $923.12 for renewed downside risk.





Latest GE Vernova News




-
 Afghanistan
-
 Albania
-
 Algeria
-
 Angola
-
 Argentina
-
 Armenia
-
 Australia
-
 Austria
-
 Azerbaijan
-
 Bahamas
-
 Bahrain
-
 Bangladesh
-
 Belarus
-
 Belgium
-
 Bolivia
-
 Botswana
-
 Brazil
-
 Brunei
-
 Bulgaria
-
 Cambodia
-
 Cameroon
-
 Canada
-
 Chile
Chile
-
 China
China
-
 Colombia
-
 Congo
Congo
-
 Costa Rica
-
 Cote d'Ivoire
-
 Croatia
-
 Cuba
Cuba
-
 Cyprus
-
 Czechia
-
 DR Congo
-
 Denmark
-
 Dominican Republic
-
 Ecuador
-
 Egypt
Egypt
-
 El Salvador
-
 Estonia
-
 Eswatini
-
 Ethiopia
-
 Finland
-
 France
-
 Georgia
-
 Germany
-
 Ghana
Ghana
-
 Greece
-
 Haiti
Haiti
-
 Hong Kong
-
 Hungary
-
 India
India
-
 Indonesia
-
 Iran, Islamic republic
-
 Iraq
Iraq
-
 Ireland
-
 Israel
-
 Italy
Italy
-
 Jamaica
-
 Japan
Japan
-
 Jordan
-
 Kazakhstan
-
 Kenya
Kenya
-
 Korea
Korea
-
 Kuwait
-
 Kyrgyzstan
-
 Laos
Laos
-
 Latvia
-
 Lebanon
-
 Lesotho
-
 Libya
Libya
-
 Lithuania
-
 Luxembourg
-
 Madagascar
-
 Malaysia
-
 Malta
Malta
-
 Mauritius
-
 Mexico
-
 Moldova
-
 Mongolia
-
 Montenegro
-
 Morocco
-
 Mozambique
-
 Myanmar
-
 Namibia
-
 Nepal
Nepal
-
 Netherlands
-
 New Zealand
-
 Nigeria
-
 North Macedonia
-
 Norway
-
 Oman
Oman
-
 Pakistan
-
 Palestine
-
 Panama
-
 Papua New Guinea
-
 Paraguay
-
 Peru
Peru
-
 Philippines
-
 Poland
-
 Portugal
-
 Puerto Rico
-
 Qatar
Qatar
-
 Reunion
-
 Romania
-
 Rwanda
-
 Saudi Arabia
-
 Serbia
-
 Singapore
-
 Slovakia
-
 Slovenia
-
 Somalia
-
 South Africa
-
 Spain
Spain
-
 Sri Lanka
-
 Sweden
-
 Switzerland
-
 Syria
Syria
-
 Taiwan
-
 Tajikistan
-
 Tanzania
-
 Thailand
-
 Trinidad and Tobago
-
 Tunisia
-
 Turkey
-
 UAE
UAE
-
 Uganda
-
 Ukraine
-
 United Kingdom
-
United States
-
 Uruguay
-
 Uzbekistan
-
 Venezuela
-
 Vietnam
-
 Yemen
Yemen
-
 Zambia
-
 Zimbabwe
- Forex
- Crypto












