


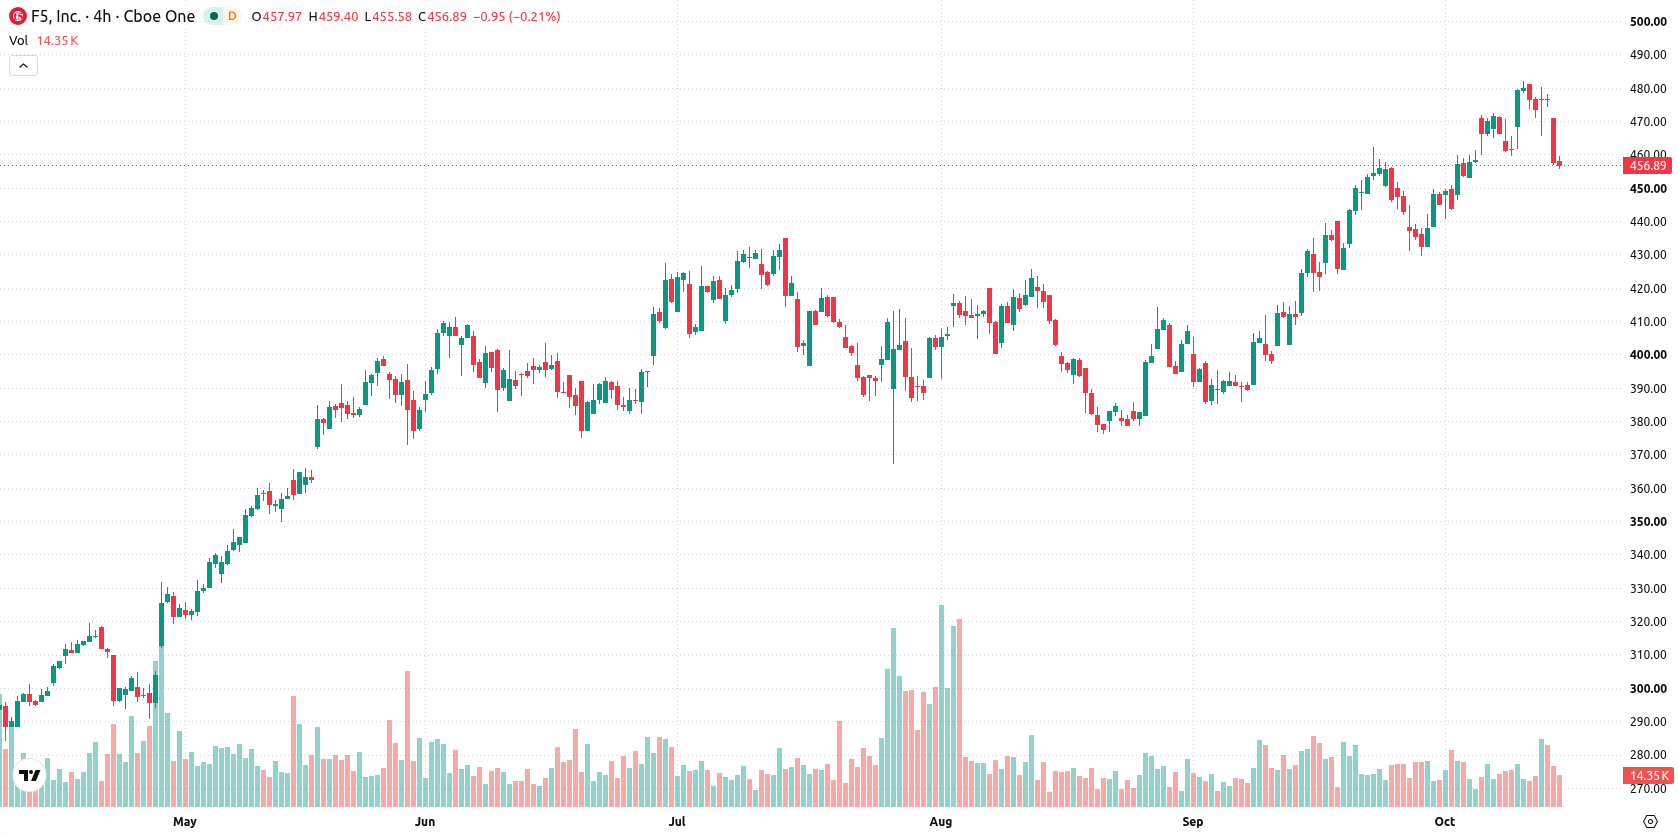
F5, Inc. (FFIV) fell 4.1% as seller activity dominated after an earlier downside gap, even as the company reached a new 52-week high with recent regulatory attention in focus. The sharp downside aligns with technical signals showing overbought conditions and an intraday sell bias, with price action holding just above key short-term support.
 458.30
482.82
458.30
482.82
Highlights
- F5 stock reached a new 52-week high and is subject to an ongoing securities investigation announced to shareholders.
- Shares delivered positive returns over the past twelve months, not including dividends, despite recent selling pressure.
- Technical signals indicate overbought conditions with bullish momentum, and the expected trading range for the next 5 sessions is $444.93 to $468.47.
Regulatory probe draws legal attention as positive yearly returns persist
F5, Inc. reached a new 52-week high with confirmation on October 9, 2026, as Bronstein, Gewirtz & Grossman, LLC encouraged shareholders to inquire about an ongoing securities investigation related to the company. Over the past twelve months, F5 recorded a year of positive returns before dividends. This regulatory development was highlighted in recent days, though price action has remained under broader selling pressure.
Bullish structure holds amid mixed momentum and heightened volatility
F5 is trading above its 20-day ($452.07), 50-day ($421.36), and 200-day ($352.43) moving averages, confirming ongoing bullish momentum across short, medium, and long-term timeframes. The longer-term bullish structure is reinforced by the alignment of the MA-50 above the MA-200, with immediate levels marked by resistance at $456.82 and support at $452.07. Momentum indicators show strong upside pressure: both the Moving Average Convergence Divergence (MACD) and Average Directional Index (ADX) signal “Buy,” while the Relative Strength Index (RSI) at 66.13 remains near overbought territory and the Commodity Channel Index (CCI) and Bull/Bear Power (BBP) both indicate overbought conditions. BBP’s positive value signals that buyers still dominate intraday momentum, yet the Stochastic RSI and Awesome Oscillator both flag neutral, pointing to mixed short-term signals. The stock is down $19.54, or 4.1% today, after a downside gap near 0.79%, trading near today’s low with intraday volatility at 3.43%. Intraday tone suggests sell pressure after the open, as momentum and volatility indicate an overbought but still active market.
Earlier, analysts noted that F5, Inc. maintained a broadly bullish technical setup supported by sustained momentum and active buyer participation. The current article introduces heightened regulatory attention and a surge in intraday volatility, making a break above $456.82 or below $444.93 the critical technical signals to monitor for the next directional move.




Latest F5 Networks News




-
 Afghanistan
-
 Albania
-
 Algeria
-
 Angola
-
 Argentina
-
 Armenia
-
 Australia
-
 Austria
-
 Azerbaijan
-
 Bahamas
-
 Bahrain
-
 Bangladesh
-
 Belarus
-
 Belgium
-
 Bolivia
-
 Botswana
-
 Brazil
-
 Brunei
-
 Bulgaria
-
 Cambodia
-
 Cameroon
-
 Canada
-
 Chile
Chile
-
 China
China
-
 Colombia
-
 Congo
Congo
-
 Costa Rica
-
 Cote d'Ivoire
-
 Croatia
-
 Cuba
Cuba
-
 Cyprus
-
 Czechia
-
 DR Congo
-
 Denmark
-
 Dominican Republic
-
 Ecuador
-
 Egypt
Egypt
-
 El Salvador
-
 Estonia
-
 Eswatini
-
 Ethiopia
-
 Finland
-
 France
-
 Georgia
-
 Germany
-
 Ghana
Ghana
-
 Greece
-
 Haiti
Haiti
-
 Hong Kong
-
 Hungary
-
 India
India
-
 Indonesia
-
 Iran, Islamic republic
-
 Iraq
Iraq
-
 Ireland
-
 Israel
-
 Italy
Italy
-
 Jamaica
-
 Japan
Japan
-
 Jordan
-
 Kazakhstan
-
 Kenya
Kenya
-
 Korea
Korea
-
 Kuwait
-
 Kyrgyzstan
-
 Laos
Laos
-
 Latvia
-
 Lebanon
-
 Lesotho
-
 Libya
Libya
-
 Lithuania
-
 Luxembourg
-
 Madagascar
-
 Malaysia
-
 Malta
Malta
-
 Mauritius
-
 Mexico
-
 Moldova
-
 Mongolia
-
 Montenegro
-
 Morocco
-
 Mozambique
-
 Myanmar
-
 Namibia
-
 Nepal
Nepal
-
 Netherlands
-
 New Zealand
-
 Nigeria
-
 North Macedonia
-
 Norway
-
 Oman
Oman
-
 Pakistan
-
 Palestine
-
 Panama
-
 Papua New Guinea
-
 Paraguay
-
 Peru
Peru
-
 Philippines
-
 Poland
-
 Portugal
-
 Puerto Rico
-
 Qatar
Qatar
-
 Reunion
-
 Romania
-
 Rwanda
-
 Saudi Arabia
-
 Serbia
-
 Singapore
-
 Slovakia
-
 Slovenia
-
 Somalia
-
 South Africa
-
 Spain
Spain
-
 Sri Lanka
-
 Sweden
-
 Switzerland
-
 Syria
Syria
-
 Taiwan
-
 Tajikistan
-
 Tanzania
-
 Thailand
-
 Trinidad and Tobago
-
 Tunisia
-
 Turkey
-
 UAE
UAE
-
 Uganda
-
 Ukraine
-
 United Kingdom
-
United States
-
 Uruguay
-
 Uzbekistan
-
 Venezuela
-
 Vietnam
-
 Yemen
Yemen
-
 Zambia
-
 Zimbabwe
- Forex
- Crypto












