

Johnson & Johnson stock faces resistance at $259.89 during consolidation: weekly analysis

Shares of Johnson & Johnson (JNJ) are trading near $259 as a recent pullback leaves the stock in oversold territory. Technical momentum has lost steam, with mixed signals and resistance continuing to pressure the weekly chart. Traders will be watching for signs of stabilization or a further drift lower in the days ahead.
 254.66
261.67
Highlights
- Shares of Johnson & Johnson are down over the past week, now trading at $259.47 below key short-term moving averages.
- Technical indicators such as MACD and Awesome Oscillator show a sell bias, with CCI moving into oversold territory and signals diverging.
- Johnson & Johnson stock is expected to consolidate between $245.21 and $259.89, with a 65% probability of a decrease next week.
Talc charge and pharma gains reshape sentiment after Q3 results
Johnson & Johnson reported third-quarter revenue of $25.4 billion on October 13, 2026, reflecting a 5.9% year-over-year increase and revised its full-year guidance, according to CNBC and the company's official website. Earnings per share were sharply impacted by a one-time $5.5 billion special charge related to proposed talc litigation settlement, while adjusted EPS reached $2.59. Pharmaceutical sales posted solid growth, but the MedTech division grew more modestly. JNJ also declared a quarterly cash dividend of $1.34 per share, payable in December 2026.
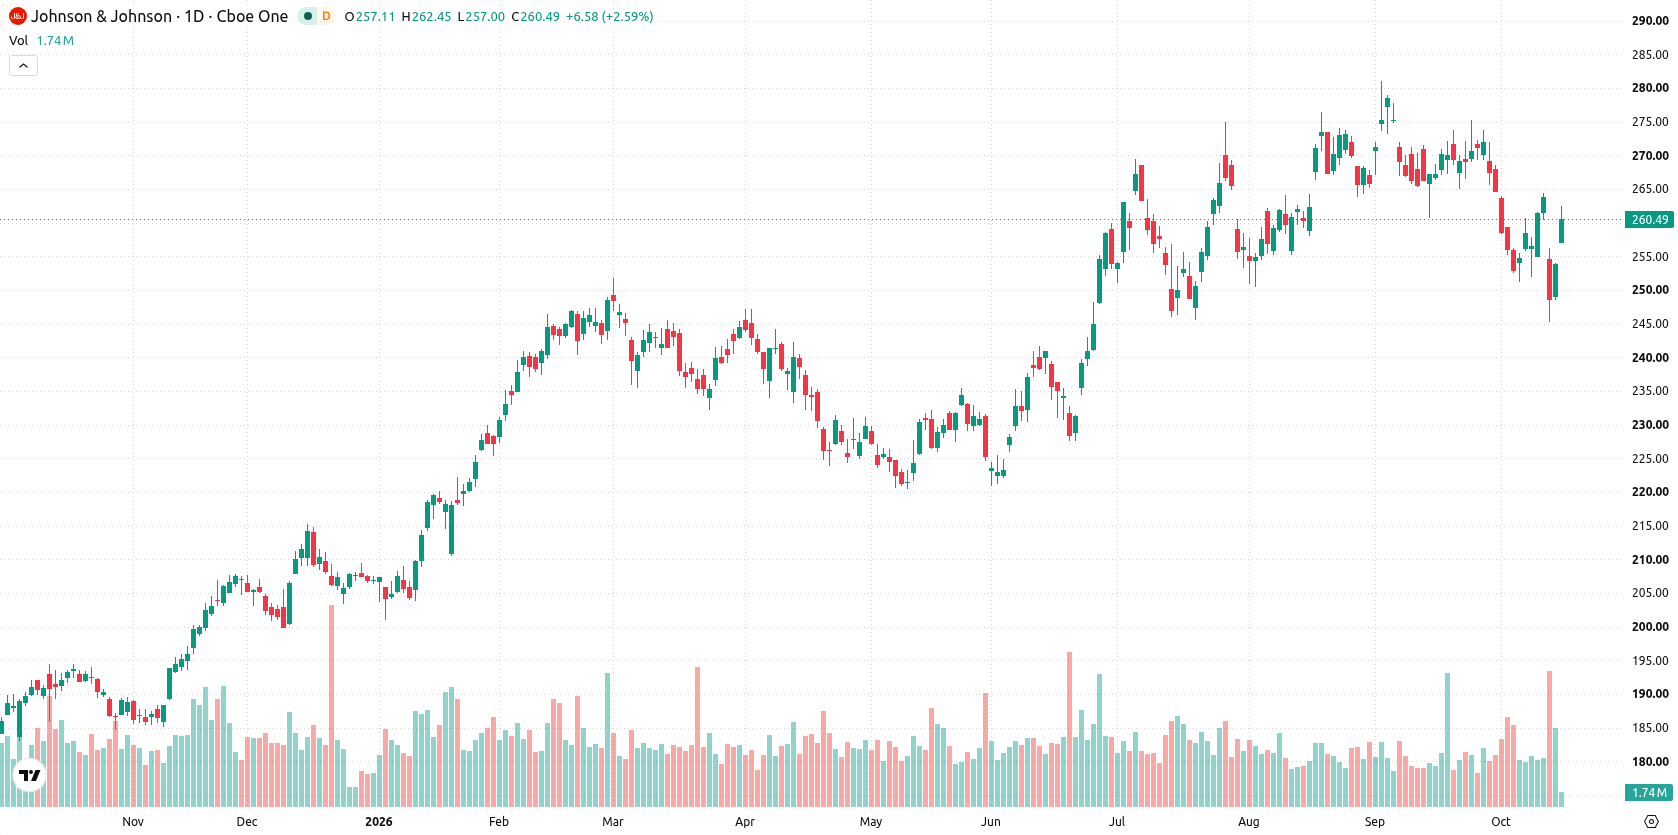
Sell bias persists as consolidation range constrains technical momentum
The daily chart shows a contained move within a narrow range, with volatility at 7.72%. MACD and the Awesome Oscillator both indicate a sell bias, while CCI is in the oversold zone at -109.18, suggesting some divergence within momentum signals. Immediate resistance is set by the Ichimoku Kijun at $259.89, which is being tested, while support lies at $245.21. These levels define a consolidation phase as short-term pressure weighs on the stock.
Downside risk remains elevated pending breakout from consolidation zone
In the week ahead, Johnson & Johnson stock is expected to trade between $251 and $267.93, with a 35% probability of an increase and a 65% probability of a decrease. The likely base case is continued consolidation between $245.21 and $259.89. A bullish reversal would require a close above $259.89, while a break below $245.21 would open the door to further downside.
Earlier, analysts noted that Johnson & Johnson’s share price decline following earnings presented an entry point, emphasizing the company’s balance-sheet strength and consistent revenue growth. The current technical setup indicates a consolidation phase with oversold conditions, making the $259.89 resistance and $245.21 support pivotal levels to monitor for signs of either stabilization or renewed downside.





Latest Johnson & Johnson News




-
 Afghanistan
-
 Albania
-
 Algeria
-
 Angola
-
 Argentina
-
 Armenia
-
 Australia
-
 Austria
-
 Azerbaijan
-
 Bahamas
-
 Bahrain
-
 Bangladesh
-
 Belarus
-
 Belgium
-
 Bolivia
-
 Botswana
-
 Brazil
-
 Brunei
-
 Bulgaria
-
 Cambodia
-
 Cameroon
-
 Canada
-
 Chile
-
 China
-
 Colombia
-
 Congo
-
 Costa Rica
-
 Cote d'Ivoire
-
 Croatia
-
 Cuba
-
 Cyprus
-
 Czechia
-
 DR Congo
-
 Denmark
-
 Dominican Republic
-
 Ecuador
-
 Egypt
-
 El Salvador
-
 Estonia
-
 Eswatini
-
 Ethiopia
-
 Finland
-
 France
-
 Georgia
-
 Germany
-
 Ghana
-
 Greece
-
 Haiti
-
 Hong Kong
-
 Hungary
-
 India
-
 Indonesia
-
 Iran, Islamic republic
-
 Iraq
-
 Ireland
-
 Israel
-
 Italy
-
 Jamaica
-
 Japan
-
 Jordan
-
 Kazakhstan
-
 Kenya
-
 Korea
-
 Kuwait
-
 Kyrgyzstan
-
 Laos
-
 Latvia
-
 Lebanon
-
 Lesotho
-
 Libya
-
 Lithuania
-
 Luxembourg
-
 Madagascar
-
 Malaysia
-
 Malta
-
 Mauritius
-
 Mexico
-
 Moldova
-
 Mongolia
-
 Montenegro
-
 Morocco
-
 Mozambique
-
 Myanmar
-
 Namibia
-
 Nepal
-
 Netherlands
-
 New Zealand
-
 Nigeria
-
 North Macedonia
-
 Norway
-
 Oman
-
 Pakistan
-
 Palestine
-
 Panama
-
 Papua New Guinea
-
 Paraguay
-
 Peru
-
 Philippines
-
 Poland
-
 Portugal
-
 Puerto Rico
-
 Qatar
-
 Reunion
-
 Romania
-
 Rwanda
-
 Saudi Arabia
-
 Serbia
-
 Singapore
-
 Slovakia
-
 Slovenia
-
 Somalia
-
 South Africa
-
 Spain
-
 Sri Lanka
-
 Sweden
-
 Switzerland
-
 Syria
-
 Taiwan
-
 Tajikistan
-
 Tanzania
-
 Thailand
-
 Trinidad and Tobago
-
 Tunisia
-
 Turkey
-
 UAE
-
 Uganda
-
 Ukraine
-
 United Kingdom
-
United States
-
 Uruguay
-
 Uzbekistan
-
 Venezuela
-
 Vietnam
-
 Yemen
-
 Zambia
-
 Zimbabwe
- Forex
- Crypto












