

Will Barrick Gold stock extend gains amid resistance test and fading momentum?

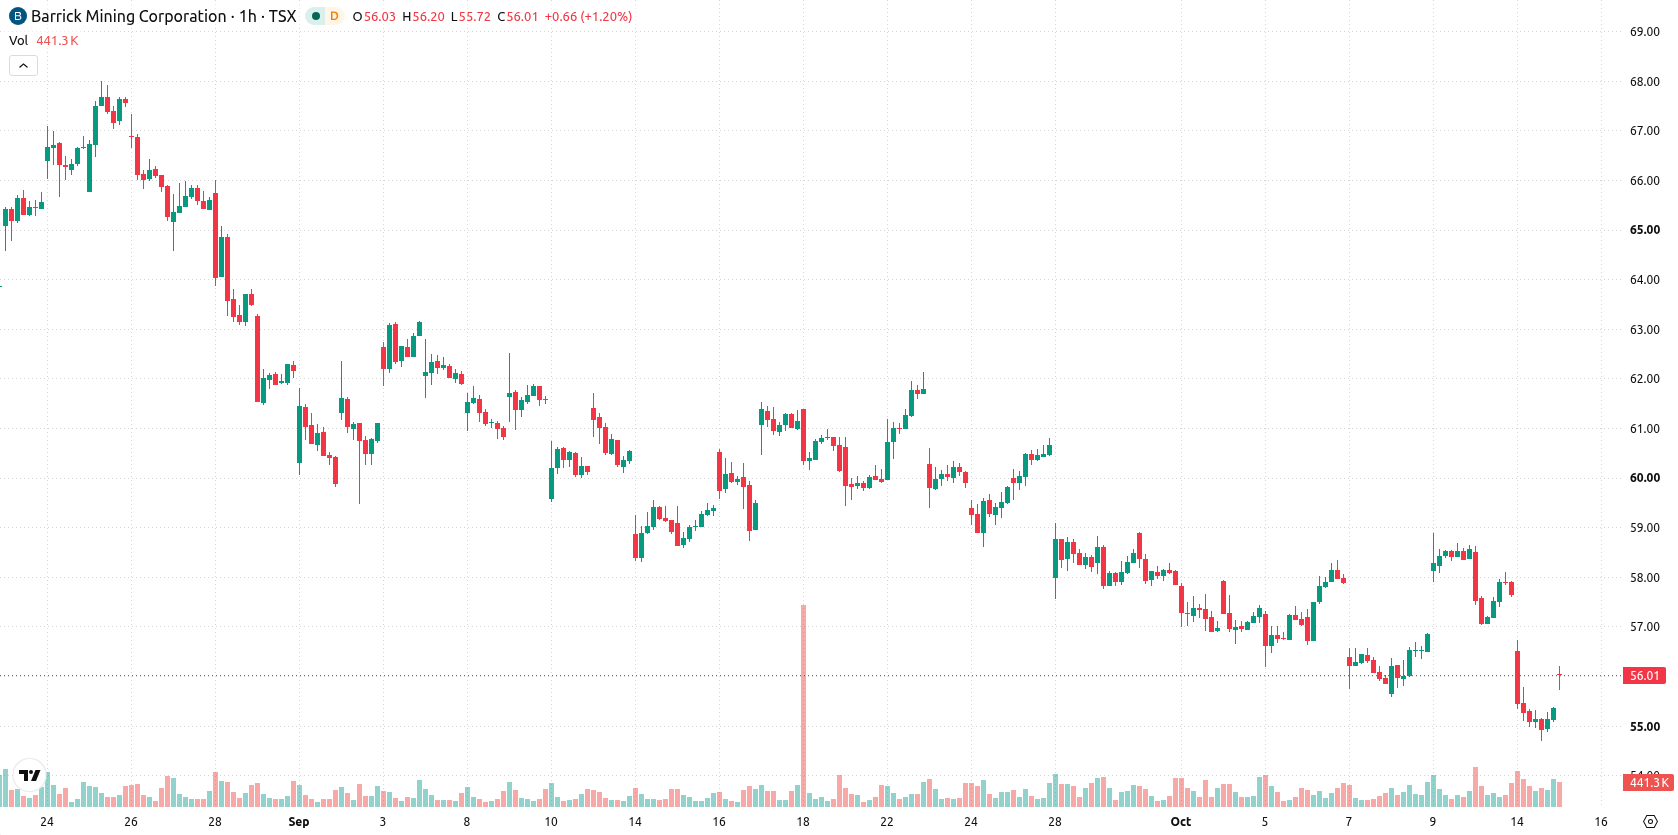
Barrick Gold (ABX) stock is trading at C$56.2, posting a daily gain of 1.54%. The price remains below its key moving averages, indicating sellers still broadly influence the stock's short-, medium-, and long-term trends.
 54.40
60.46
Highlights
- Shares of Barrick Gold remain below key short-, medium-, and long-term moving averages, indicating ongoing downside pressure.
- Momentum indicators including MACD and ADX show a sell bias, while oscillators trend bearish without reaching extreme levels.
- Barrick Gold stock is likely to trade between C$54.32 and C$58.08 in coming days, with a 67% probability of moving lower.
Technical resistance holds as weak momentum persists intraday
On the H1 chart, ABX remains below its MA-20 at C$56.86 and MA-50 at C$56.88, while the daily chart positions the stock under the long-term MA-200 at C$59.12. The Ichimoku Kijun at C$56.79 serves as immediate resistance. Momentum remains weak as MACD and ADX both signal a sell bias, and while RSI, CCI, and Stoch RSI avoid overbought or oversold extremes, these indicators maintain a bearish tilt. Notably, Bull/Bear Power registers a buy, pointing to a subtle edge for buyers intraday, in contrast to broader momentum signals.
Downside risk dominates as price range narrows
Over the next several trading days, ABX is expected to fluctuate between C$54.32 and C$58.08. With a 33% probability of an upward move and a 67% probability of a downward move, a decline is more likely than a rebound. The baseline outlook is for the stock to remain rangebound within this corridor, while a bullish scenario would require a breakout above the Ichimoku Kijun resistance. A bearish outcome would likely be confirmed by a drop below the projected support levels.
Earlier, analysts noted that Barrick Gold faced persistent technical weakness and ongoing downside risk. The latest price action and momentum readings reinforce this cautious outlook, with traders advised to monitor the stock's ability to reclaim key resistance levels for signs of a potential trend reversal.






Latest Barrick Gold News




-
 Afghanistan
-
 Albania
-
 Algeria
-
 Angola
-
 Argentina
-
 Armenia
-
 Australia
-
 Austria
-
 Azerbaijan
-
 Bahamas
-
 Bahrain
-
 Bangladesh
-
 Belarus
-
 Belgium
-
 Bolivia
-
 Botswana
-
 Brazil
-
 Brunei
-
 Bulgaria
-
 Cambodia
-
 Cameroon
-
 Canada
-
 Chile
-
 China
-
 Colombia
-
 Congo
-
 Costa Rica
-
 Cote d'Ivoire
-
 Croatia
-
 Cuba
-
 Cyprus
-
 Czechia
-
 DR Congo
-
 Denmark
-
 Dominican Republic
-
 Ecuador
-
 Egypt
-
 El Salvador
-
 Estonia
-
 Eswatini
-
 Ethiopia
-
 Finland
-
 France
-
 Georgia
-
 Germany
-
 Ghana
-
 Greece
-
 Haiti
-
 Hong Kong
-
 Hungary
-
 India
-
 Indonesia
-
 Iran, Islamic republic
-
 Iraq
-
 Ireland
-
 Israel
-
 Italy
-
 Jamaica
-
 Japan
-
 Jordan
-
 Kazakhstan
-
 Kenya
-
 Korea
-
 Kuwait
-
 Kyrgyzstan
-
 Laos
-
 Latvia
-
 Lebanon
-
 Lesotho
-
 Libya
-
 Lithuania
-
 Luxembourg
-
 Madagascar
-
 Malaysia
-
 Malta
-
 Mauritius
-
 Mexico
-
 Moldova
-
 Mongolia
-
 Montenegro
-
 Morocco
-
 Mozambique
-
 Myanmar
-
 Namibia
-
 Nepal
-
 Netherlands
-
 New Zealand
-
 Nigeria
-
 North Macedonia
-
 Norway
-
 Oman
-
 Pakistan
-
 Palestine
-
 Panama
-
 Papua New Guinea
-
 Paraguay
-
 Peru
-
 Philippines
-
 Poland
-
 Portugal
-
 Puerto Rico
-
 Qatar
-
 Reunion
-
 Romania
-
 Rwanda
-
 Saudi Arabia
-
 Serbia
-
 Singapore
-
 Slovakia
-
 Slovenia
-
 Somalia
-
 South Africa
-
 Spain
-
 Sri Lanka
-
 Sweden
-
 Switzerland
-
 Syria
-
 Taiwan
-
 Tajikistan
-
 Tanzania
-
 Thailand
-
 Trinidad and Tobago
-
 Tunisia
-
 Turkey
-
 UAE
-
 Uganda
-
 Ukraine
-
 United Kingdom
-
United States
-
 Uruguay
-
 Uzbekistan
-
 Venezuela
-
 Vietnam
-
 Yemen
-
 Zambia
-
 Zimbabwe
- Forex
- Crypto












