

Barrick Gold stock drops as sellers maintain control after early gap down

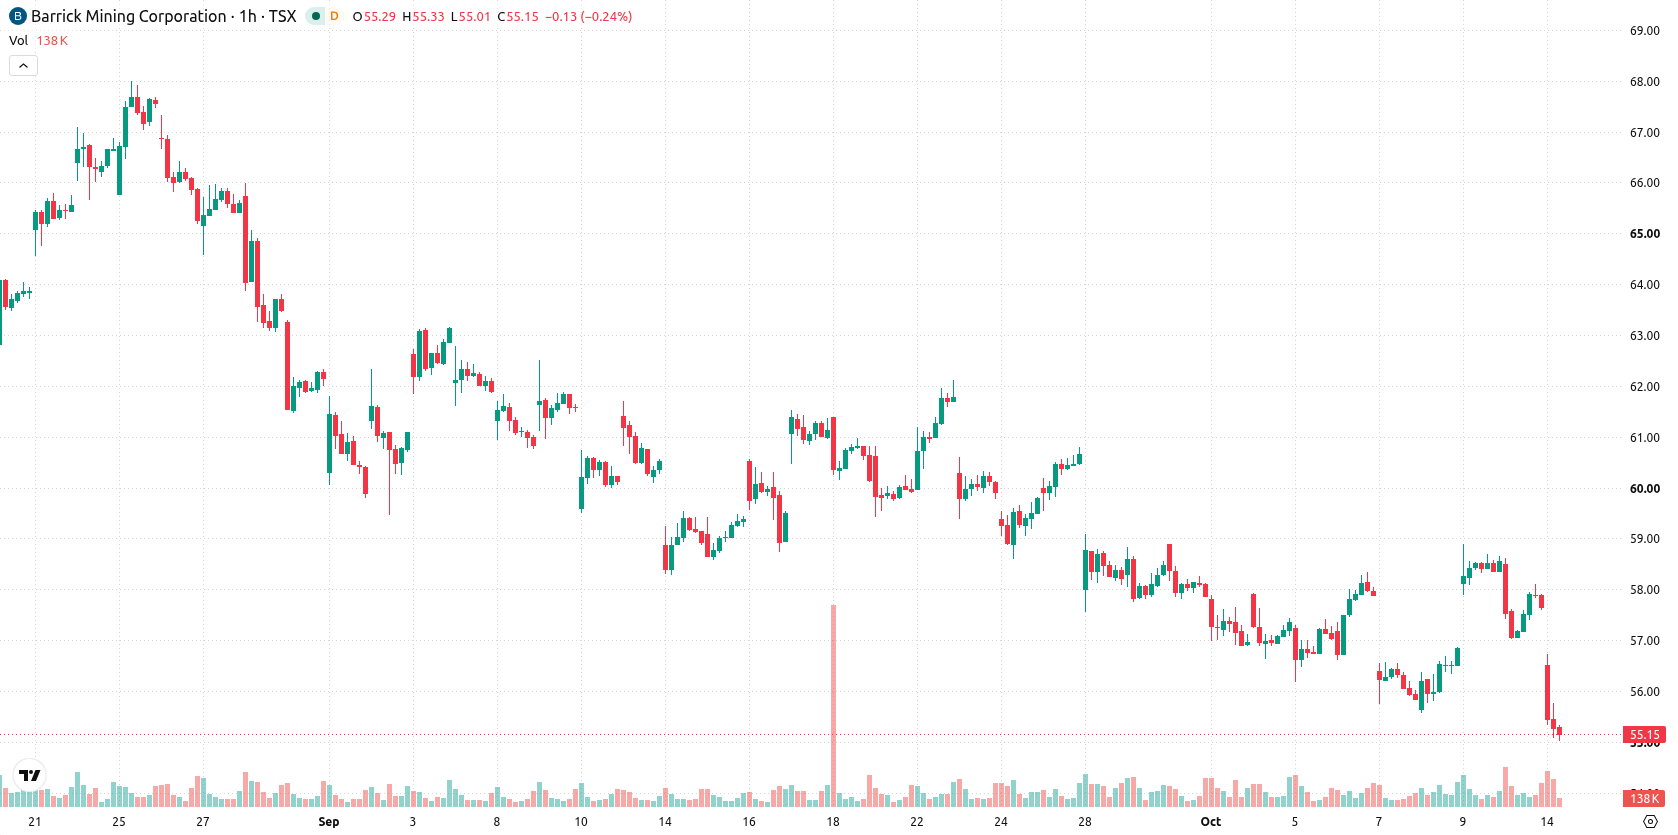
Barrick Gold (ABX) stock is trading at C$55.08, down 4.51% for the day. The price has moved below its key moving averages, reflecting broad seller dominance across major timeframes.
 52.14
55.57
Highlights
- ABX/CAD trades below key moving averages on both hourly and daily charts, indicating broad seller control across timeframes.
- Technical indicators present a mixed picture, but most momentum and oscillator signals register oversold or point to continued selling.
- Price closed at C$55.08 after falling 4.51%, with an expected range of C$53.64 to C$56.52 in the coming days.
Mixed momentum as multiple indicators confirm seller bias
On the technical front, ABX is trading below its MA-20 (C$57.53) and MA-50 (C$57.16) on the hourly chart, as well as below the long-term MA-200 (C$59.15) on the daily chart. The Ichimoku Kijun at C$57.23 is acting as immediate resistance. Momentum indicators are mixed: MACD signals a strong buy, but ADX leans bearish, and the RSI stands at 36.56, with Stoch RSI, CCI, and Bull/Bear Power all reading oversold or sell. Price action finished near the daily low after a gap down, aligning with the prevailing seller bias.
Downside risk prevails as price nears volatility band floor
Over the next several days, ABX is expected to range between C$53.64 and C$56.52. The probability of an upward move is calculated at 29%, while a downward move is more likely at 71%. The baseline scenario calls for continued sideways trading within this volatility band, with a bullish move requiring a break above C$57.23, and potential downside if support is breached into the lower end of the forecasted range.
Previously, analysts noted that Barrick Gold was weighed down by persistent technical weakness and sustained selling pressure. The latest developments reinforce this bearish outlook, with current indicators suggesting that further downside risk remains if the lower end of the projected trading range is breached in the coming sessions.






Latest Barrick Gold News




-
 Afghanistan
-
 Albania
-
 Algeria
-
 Angola
-
 Argentina
-
 Armenia
-
 Australia
-
 Austria
-
 Azerbaijan
-
 Bahamas
-
 Bahrain
-
 Bangladesh
-
 Belarus
-
 Belgium
-
 Bolivia
-
 Botswana
-
 Brazil
-
 Brunei
-
 Bulgaria
-
 Cambodia
-
 Cameroon
-
 Canada
-
 Chile
-
 China
-
 Colombia
-
 Congo
-
 Costa Rica
-
 Cote d'Ivoire
-
 Croatia
-
 Cuba
-
 Cyprus
-
 Czechia
-
 DR Congo
-
 Denmark
-
 Dominican Republic
-
 Ecuador
-
 Egypt
-
 El Salvador
-
 Estonia
-
 Eswatini
-
 Ethiopia
-
 Finland
-
 France
-
 Georgia
-
 Germany
-
 Ghana
-
 Greece
-
 Haiti
-
 Hong Kong
-
 Hungary
-
 India
-
 Indonesia
-
 Iran, Islamic republic
-
 Iraq
-
 Ireland
-
 Israel
-
 Italy
-
 Jamaica
-
 Japan
-
 Jordan
-
 Kazakhstan
-
 Kenya
-
 Korea
-
 Kuwait
-
 Kyrgyzstan
-
 Laos
-
 Latvia
-
 Lebanon
-
 Lesotho
-
 Libya
-
 Lithuania
-
 Luxembourg
-
 Madagascar
-
 Malaysia
-
 Malta
-
 Mauritius
-
 Mexico
-
 Moldova
-
 Mongolia
-
 Montenegro
-
 Morocco
-
 Mozambique
-
 Myanmar
-
 Namibia
-
 Nepal
-
 Netherlands
-
 New Zealand
-
 Nigeria
-
 North Macedonia
-
 Norway
-
 Oman
-
 Pakistan
-
 Palestine
-
 Panama
-
 Papua New Guinea
-
 Paraguay
-
 Peru
-
 Philippines
-
 Poland
-
 Portugal
-
 Puerto Rico
-
 Qatar
-
 Reunion
-
 Romania
-
 Rwanda
-
 Saudi Arabia
-
 Serbia
-
 Singapore
-
 Slovakia
-
 Slovenia
-
 Somalia
-
 South Africa
-
 Spain
-
 Sri Lanka
-
 Sweden
-
 Switzerland
-
 Syria
-
 Taiwan
-
 Tajikistan
-
 Tanzania
-
 Thailand
-
 Trinidad and Tobago
-
 Tunisia
-
 Turkey
-
 UAE
-
 Uganda
-
 Ukraine
-
 United Kingdom
-
United States
-
 Uruguay
-
 Uzbekistan
-
 Venezuela
-
 Vietnam
-
 Yemen
-
 Zambia
-
 Zimbabwe
- Forex
- Crypto












