

ABX extends slide as downward price move dominates short-term trading

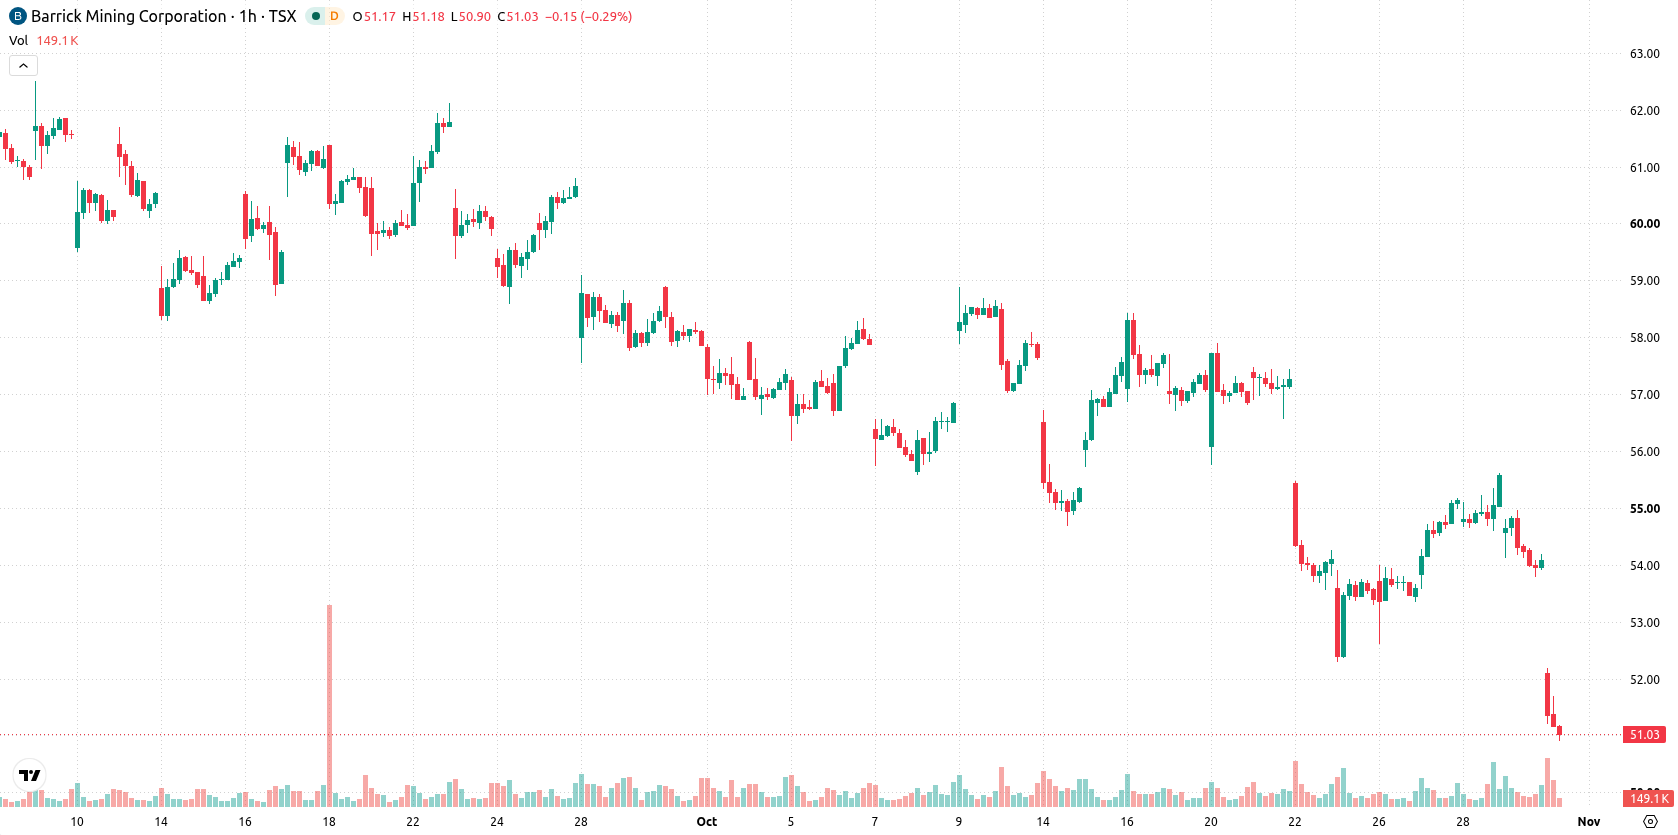
Barrick Gold (ABX) stock is trading at C$51.25, down 5.29% on the day after a downside gap. The price currently sits below its key moving averages, reflecting broad selling momentum.
 53.35
55.57
Highlights
- ABX/CAD stock closed at C$51.25, down 5.29% after a downside gap and finishing near the session low.
- The stock trades below key moving averages on multiple timeframes, with momentum indicators showing sustained seller dominance and oversold conditions.
- The expected trading range for the next few days is C$49.92 to C$52.58, with a high probability of further downside unless resistance at C$53.53 is broken.
Bearish momentum intensifies as major indicators confirm weakness
On the technical side, ABX/CAD is trading below its MA-20 and MA-50 on the H1 timeframe, and remains under the daily MA-200. The Ichimoku Kijun stands at C$53.53, offering immediate resistance. Momentum indicators align with the negative trend: both MACD and ADX show clear Sell signals, RSI is at 25.39 indicating oversold conditions, while Stoch RSI, CCI, and Bull/Bear Power also reflect strong seller dominance. The Awesome Oscillator is neutral and does not confirm the downward move.
Downside bias persists amid low reversal probability
In the short term, the expected trading range for ABX is C$49.92 to C$52.58. The likelihood of an upward move is assessed as very low, while a continued decline remains highly probable. The baseline scenario calls for prices to consolidate within this lower range; a breakout above C$53.53 would be needed for a bullish reversal, while a breach below C$49.92 would likely trigger further downside.
Earlier, analysts noted that Barrick Gold was facing persistent technical weakness and suggested a continued downside risk. The latest technical signals reinforce this negative outlook, with traders now advised to closely monitor the C$49.92 level as a potential trigger for further declines.










-
 Afghanistan
-
 Albania
-
 Algeria
-
 Angola
-
 Argentina
-
 Armenia
-
 Australia
-
 Austria
-
 Azerbaijan
-
 Bahamas
-
 Bahrain
-
 Bangladesh
-
 Belarus
-
 Belgium
-
 Bolivia
-
 Botswana
-
 Brazil
-
 Brunei
-
 Bulgaria
-
 Cambodia
-
 Cameroon
-
 Canada
-
 Chile
-
 China
-
 Colombia
-
 Congo
-
 Costa Rica
-
 Cote d'Ivoire
-
 Croatia
-
 Cuba
-
 Cyprus
-
 Czechia
-
 DR Congo
-
 Denmark
-
 Dominican Republic
-
 Ecuador
-
 Egypt
-
 El Salvador
-
 Estonia
-
 Eswatini
-
 Ethiopia
-
 Finland
-
 France
-
 Georgia
-
 Germany
-
 Ghana
-
 Greece
-
 Haiti
-
 Hong Kong
-
 Hungary
-
 India
-
 Indonesia
-
 Iran, Islamic republic
-
 Iraq
-
 Ireland
-
 Israel
-
 Italy
-
 Jamaica
-
 Japan
-
 Jordan
-
 Kazakhstan
-
 Kenya
-
 Korea
-
 Kuwait
-
 Kyrgyzstan
-
 Laos
-
 Latvia
-
 Lebanon
-
 Lesotho
-
 Libya
-
 Lithuania
-
 Luxembourg
-
 Madagascar
-
 Malaysia
-
 Malta
-
 Mauritius
-
 Mexico
-
 Moldova
-
 Mongolia
-
 Montenegro
-
 Morocco
-
 Mozambique
-
 Myanmar
-
 Namibia
-
 Nepal
-
 Netherlands
-
 New Zealand
-
 Nigeria
-
 North Macedonia
-
 Norway
-
 Oman
-
 Pakistan
-
 Palestine
-
 Panama
-
 Papua New Guinea
-
 Paraguay
-
 Peru
-
 Philippines
-
 Poland
-
 Portugal
-
 Puerto Rico
-
 Qatar
-
 Reunion
-
 Romania
-
 Rwanda
-
 Saudi Arabia
-
 Serbia
-
 Singapore
-
 Slovakia
-
 Slovenia
-
 Somalia
-
 South Africa
-
 Spain
-
 Sri Lanka
-
 Sweden
-
 Switzerland
-
 Syria
-
 Taiwan
-
 Tajikistan
-
 Tanzania
-
 Thailand
-
 Trinidad and Tobago
-
 Tunisia
-
 Turkey
-
 UAE
-
 Uganda
-
 Ukraine
-
 United Kingdom
-
United States
-
 Uruguay
-
 Uzbekistan
-
 Venezuela
-
 Vietnam
-
 Yemen
-
 Zambia
-
 Zimbabwe
- Forex
- Crypto












