

Will Barrick Gold stock break C$55.37 resistance as buyers position ahead of earnings?

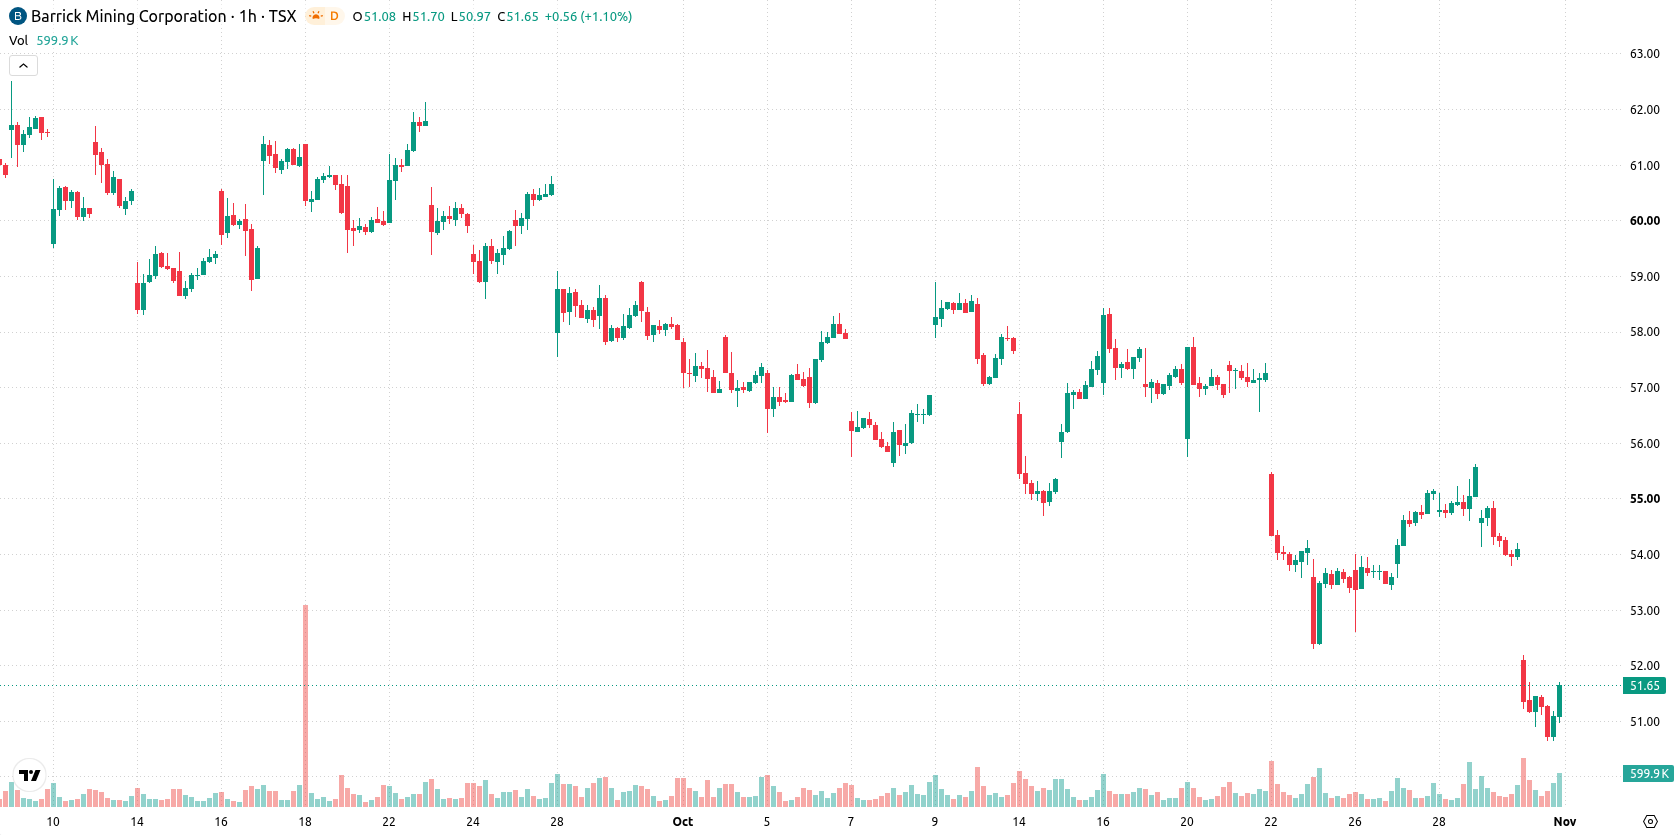
Barrick Gold (ABX) stock is trading at C$53.16, up 2.96% for the day, with the price currently positioned below its key moving averages. This reflects ongoing pressure from sellers despite today's intraday gain.
 53.66
55.57
Highlights
- Barrick Gold will release its Q3 2026 earnings before the market opens on November 9, creating a focal point for investors.
- Anticipation of earnings disclosure is contributing to increased trading activity and possible volatility in Barrick Gold stock.
- Barrick Gold stock trades below key moving averages, with technical indicators showing a dominant sell bias and an expected price range of C$50.95 to C$55.37 for the next 2 to 3 days.
Rising demand as Q3 earnings preview heightens event-driven sentiment
Barrick Gold is drawing investor attention ahead of its scheduled Q3 2026 earnings release before the market opens on November 9, according to MarketBeat. This confirmed event heightens expectations surrounding the company’s operational and financial results, shaping sentiment and contributing to buying interest. The approach of this key disclosure has strengthened demand, as market participants position in anticipation of potential volatility and news catalysts.
Bearish technical signals as price tests layered support and mixed momentum
On the H1 chart, ABX is trading below its MA-20 at C$53.44 and MA-50 at C$53.82, while on the daily chart it remains under the long-term MA-200 at C$58.57. Immediate support is located at the Ichimoku Kijun level of C$53.13. Among momentum indicators, MACD and ADX both signal a sell bias, with RSI at 35.09, CCI in sell territory, and Bull/Bear Power confirming seller dominance during intraday sessions. Meanwhile, the Stochastic RSI and Awesome Oscillator are both neutral, highlighting mixed momentum signals relative to the overall price action.
Sideways outlook as volatility band underscores directional uncertainty
In the short term, ABX is forecast to trade within a range of C$50.95 to C$55.37 over the next 2–3 sessions, marking a typical volatility band relative to current levels. The baseline scenario anticipates sideways movement within this corridor, as the balance between buyers and sellers remains uncertain. A bullish move could materialize if price breaks through resistance at C$55.37, prompting additional upward momentum, whereas a drop below C$50.95 would likely confirm renewed downside pressure.
Earlier, analysts noted that Barrick Gold was experiencing persistent technical weakness with continued downside risk. The latest analysis adds a new dimension by highlighting heightened positioning ahead of the upcoming earnings report, with traders advised to closely monitor the C$55.37 resistance for signs of a potential bullish breakout.






Latest Barrick Gold News




-
 Afghanistan
-
 Albania
-
 Algeria
-
 Angola
-
 Argentina
-
 Armenia
-
 Australia
-
 Austria
-
 Azerbaijan
-
 Bahamas
-
 Bahrain
-
 Bangladesh
-
 Belarus
-
 Belgium
-
 Bolivia
-
 Botswana
-
 Brazil
-
 Brunei
-
 Bulgaria
-
 Cambodia
-
 Cameroon
-
 Canada
-
 Chile
-
 China
-
 Colombia
-
 Congo
-
 Costa Rica
-
 Cote d'Ivoire
-
 Croatia
-
 Cuba
-
 Cyprus
-
 Czechia
-
 DR Congo
-
 Denmark
-
 Dominican Republic
-
 Ecuador
-
 Egypt
-
 El Salvador
-
 Estonia
-
 Eswatini
-
 Ethiopia
-
 Finland
-
 France
-
 Georgia
-
 Germany
-
 Ghana
-
 Greece
-
 Haiti
-
 Hong Kong
-
 Hungary
-
 India
-
 Indonesia
-
 Iran, Islamic republic
-
 Iraq
-
 Ireland
-
 Israel
-
 Italy
-
 Jamaica
-
 Japan
-
 Jordan
-
 Kazakhstan
-
 Kenya
-
 Korea
-
 Kuwait
-
 Kyrgyzstan
-
 Laos
-
 Latvia
-
 Lebanon
-
 Lesotho
-
 Libya
-
 Lithuania
-
 Luxembourg
-
 Madagascar
-
 Malaysia
-
 Malta
-
 Mauritius
-
 Mexico
-
 Moldova
-
 Mongolia
-
 Montenegro
-
 Morocco
-
 Mozambique
-
 Myanmar
-
 Namibia
-
 Nepal
-
 Netherlands
-
 New Zealand
-
 Nigeria
-
 North Macedonia
-
 Norway
-
 Oman
-
 Pakistan
-
 Palestine
-
 Panama
-
 Papua New Guinea
-
 Paraguay
-
 Peru
-
 Philippines
-
 Poland
-
 Portugal
-
 Puerto Rico
-
 Qatar
-
 Reunion
-
 Romania
-
 Rwanda
-
 Saudi Arabia
-
 Serbia
-
 Singapore
-
 Slovakia
-
 Slovenia
-
 Somalia
-
 South Africa
-
 Spain
-
 Sri Lanka
-
 Sweden
-
 Switzerland
-
 Syria
-
 Taiwan
-
 Tajikistan
-
 Tanzania
-
 Thailand
-
 Trinidad and Tobago
-
 Tunisia
-
 Turkey
-
 UAE
-
 Uganda
-
 Ukraine
-
 United Kingdom
-
United States
-
 Uruguay
-
 Uzbekistan
-
 Venezuela
-
 Vietnam
-
 Yemen
-
 Zambia
-
 Zimbabwe
- Forex
- Crypto












