

Barrick Gold stock slumps over 5% as technical selling pressure dominates

Barrick Gold Corporation (ABX) slumped 5.03% today as renewed technical selling pressure took hold in the absence of fresh company news. The move is supported by persistent weakness across all key moving averages and oversold momentum indicators.
 53.66
55.57
Highlights
- Barrick Gold stock trades below key short, medium, and long-term moving averages, signaling sustained downward momentum.
- Momentum indicators such as MACD, RSI, and CCI collectively indicate oversold conditions and ongoing seller dominance.
- Expected five-day trading range is C$49.88 to C$54.22, with a very high probability of further downside movement.
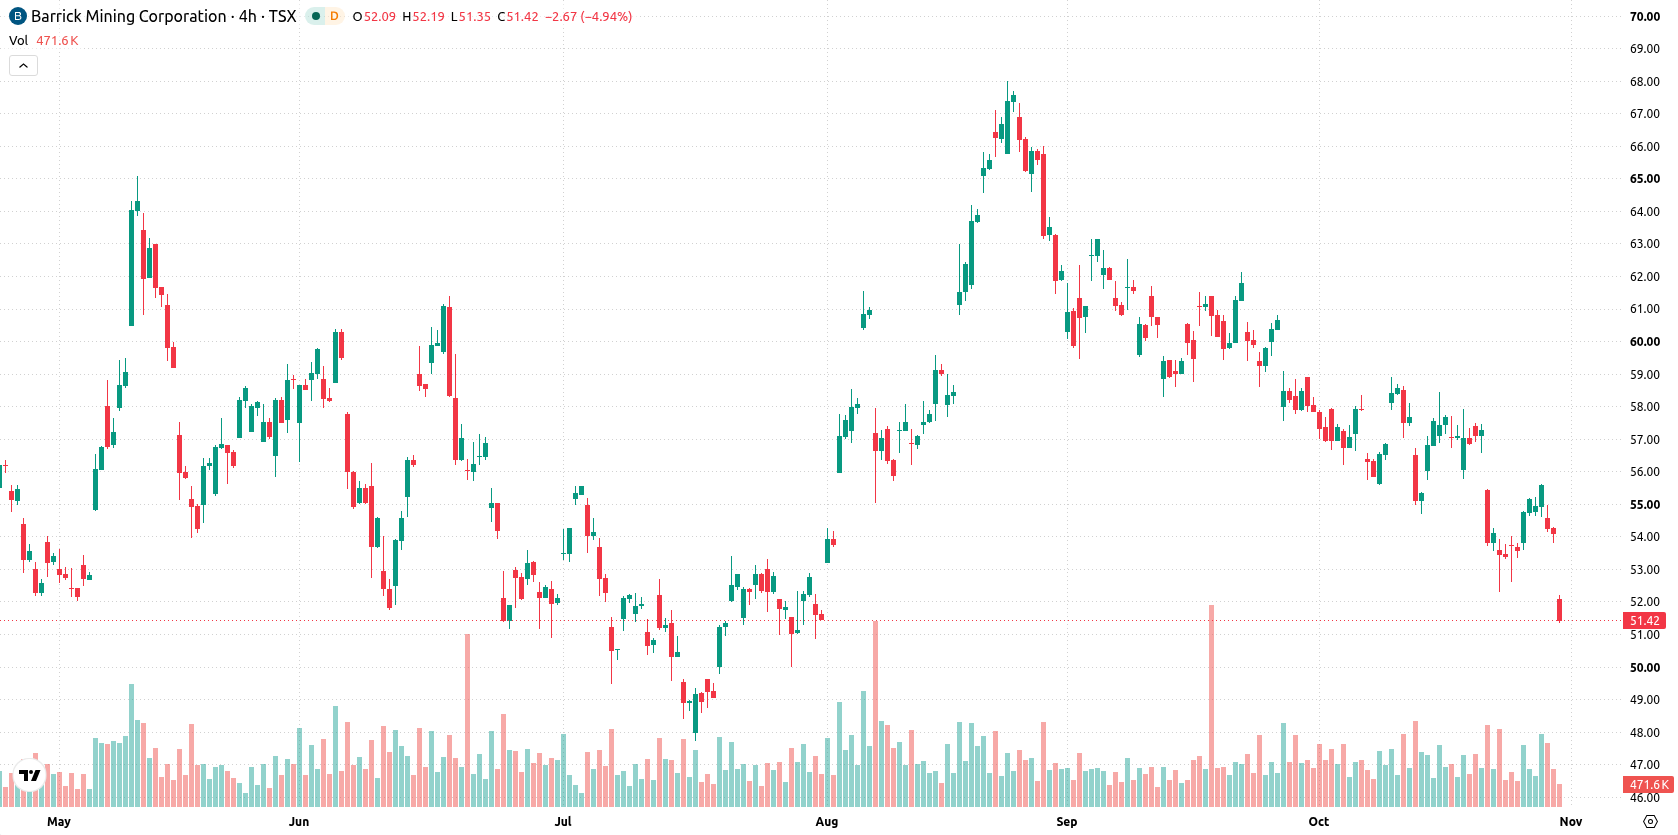
Oversold signals deepen as price falls below key averages
Barrick Gold is trading below the 20-day (C$56.29), 50-day (C$59.47), and 200-day (C$58.66) moving averages, indicating persistent downward pressure across short-, medium-, and long-term trends. The nearest resistance is the intraday high at C$52.18, with the closest support identified at C$49.88. Moving average alignment between the 50-day and 200-day remains bullish in broader trend context. Momentum signals remain weak as the MACD shows a bearish reading, and the ADX indicates a lack of strong trend strength. RSI, Stochastic RSI, and CCI all yield "sell" signals, highlighting oversold conditions. The BBP at -0.69 confirms sellers dominate intraday momentum and flags the stock as oversold. Price action is near the session low, and intraday volatility stands at 1.54%. The intraday tone remains under persistent selling pressure after the open, matching the bearish momentum outlook.
In a recent review, analysts highlighted Barrick Gold's persistent technical weakness and continued downside risk amid selling pressure. The latest slump and entrenched bearish indicators reinforce that the immediate key level to monitor is C$49.88, as a breakdown here could signal further downside in the coming sessions.










-
 Afghanistan
-
 Albania
-
 Algeria
-
 Angola
-
 Argentina
-
 Armenia
-
 Australia
-
 Austria
-
 Azerbaijan
-
 Bahamas
-
 Bahrain
-
 Bangladesh
-
 Belarus
-
 Belgium
-
 Bolivia
-
 Botswana
-
 Brazil
-
 Brunei
-
 Bulgaria
-
 Cambodia
-
 Cameroon
-
 Canada
-
 Chile
-
 China
-
 Colombia
-
 Congo
-
 Costa Rica
-
 Cote d'Ivoire
-
 Croatia
-
 Cuba
-
 Cyprus
-
 Czechia
-
 DR Congo
-
 Denmark
-
 Dominican Republic
-
 Ecuador
-
 Egypt
-
 El Salvador
-
 Estonia
-
 Eswatini
-
 Ethiopia
-
 Finland
-
 France
-
 Georgia
-
 Germany
-
 Ghana
-
 Greece
-
 Haiti
-
 Hong Kong
-
 Hungary
-
 India
-
 Indonesia
-
 Iran, Islamic republic
-
 Iraq
-
 Ireland
-
 Israel
-
 Italy
-
 Jamaica
-
 Japan
-
 Jordan
-
 Kazakhstan
-
 Kenya
-
 Korea
-
 Kuwait
-
 Kyrgyzstan
-
 Laos
-
 Latvia
-
 Lebanon
-
 Lesotho
-
 Libya
-
 Lithuania
-
 Luxembourg
-
 Madagascar
-
 Malaysia
-
 Malta
-
 Mauritius
-
 Mexico
-
 Moldova
-
 Mongolia
-
 Montenegro
-
 Morocco
-
 Mozambique
-
 Myanmar
-
 Namibia
-
 Nepal
-
 Netherlands
-
 New Zealand
-
 Nigeria
-
 North Macedonia
-
 Norway
-
 Oman
-
 Pakistan
-
 Palestine
-
 Panama
-
 Papua New Guinea
-
 Paraguay
-
 Peru
-
 Philippines
-
 Poland
-
 Portugal
-
 Puerto Rico
-
 Qatar
-
 Reunion
-
 Romania
-
 Rwanda
-
 Saudi Arabia
-
 Serbia
-
 Singapore
-
 Slovakia
-
 Slovenia
-
 Somalia
-
 South Africa
-
 Spain
-
 Sri Lanka
-
 Sweden
-
 Switzerland
-
 Syria
-
 Taiwan
-
 Tajikistan
-
 Tanzania
-
 Thailand
-
 Trinidad and Tobago
-
 Tunisia
-
 Turkey
-
 UAE
-
 Uganda
-
 Ukraine
-
 United Kingdom
-
United States
-
 Uruguay
-
 Uzbekistan
-
 Venezuela
-
 Vietnam
-
 Yemen
-
 Zambia
-
 Zimbabwe
- Forex
- Crypto












