

Verizon stock sellers keep pressure with the setup deep in oversold territory: weekly analysis

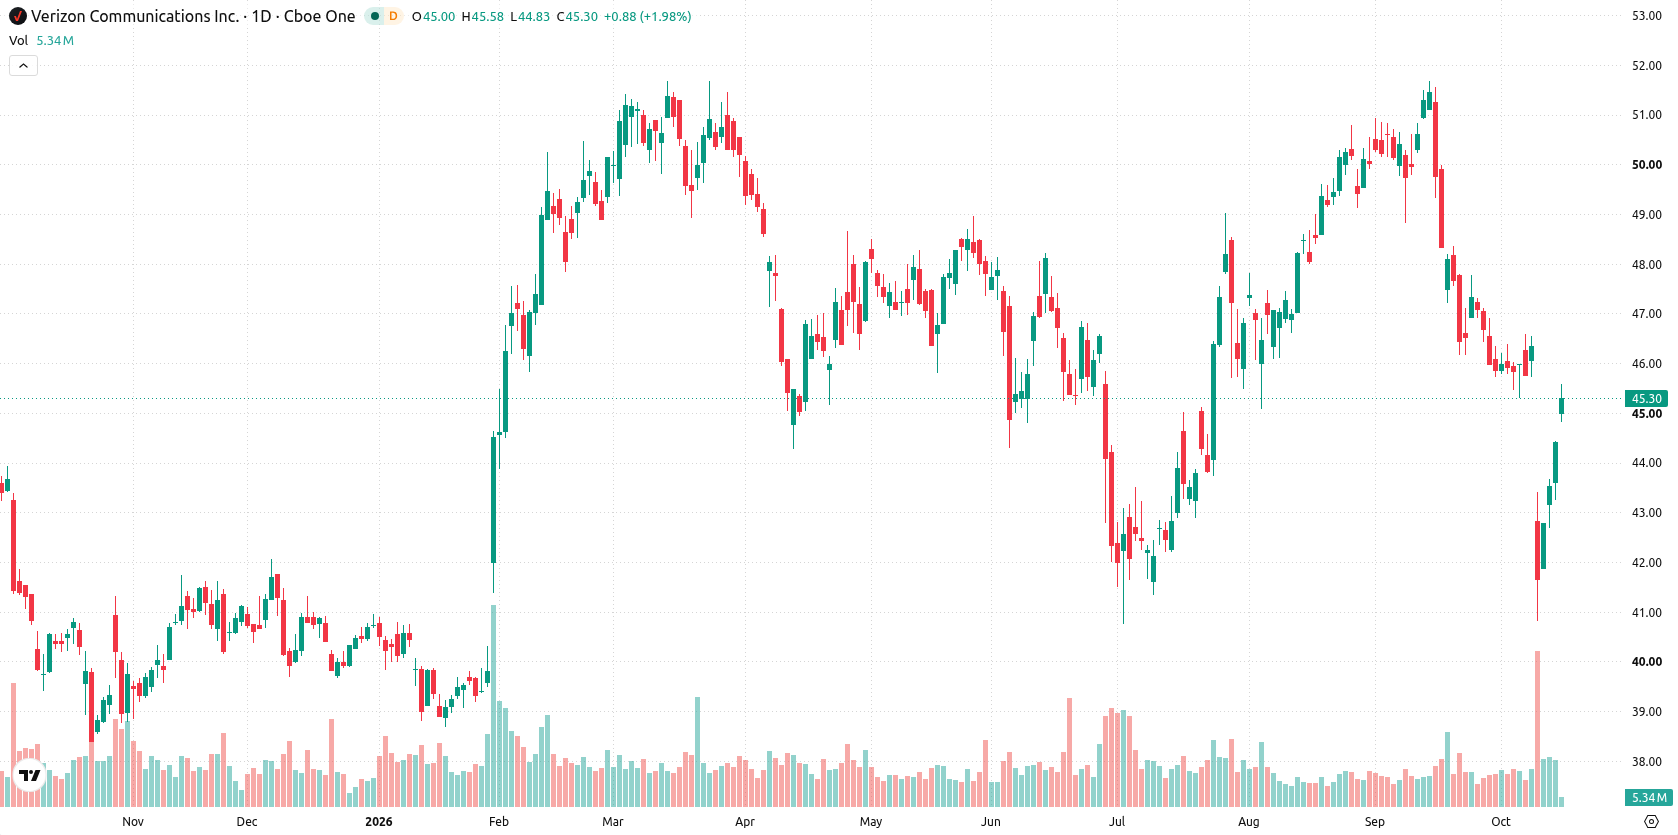
Shares of Verizon Communications Inc. (VZ) are trading near $45, up around 8.5% for the week as technical signals remain conflicted. Bears have kept pressure on the stock despite a sharp weekly advance, with momentum indicators flashing oversold and overbought conditions side by side. This mixed setup leaves sellers in control as the week ahead tests the strength of support zones.
 45.25
45.31
Highlights
- Shares of Verizon rose $3.56 over the past week to $45.26 but remain under key moving averages.
- Technical indicators show short-term pressure with bearish momentum dominating and mixed signals about oversold and overbought conditions.
- Verizon stock is projected to trade between $41.74 and $46.86 next week, with support at $44.42 and resistance at $45.89.
Strategic broadband rollout and executive share sale shape sentiment this week
Verizon launched a new broadband expansion program after securing a $1.5 billion investment from Bain Capital and Tillman Global Holdings to boost its fiber broadband rollout, supporting the integration of Ripple Fiber assets, as reported by Simply Wall St News. The company also reported that Executive Vice President Kyle Malady sold $47,223 worth of shares on October 13, 2026, according to Investing.com. In addition, Verizon is offering complimentary safety features and six months of Google AI Pro to eligible subscribers, initiatives highlighted by GlobeNewswire and Android Police.
Bearish momentum persists as technicals diverge near resistance levels
The daily chart shows the stock near the top of its recent weekly range with a sustained move higher and a firm trend, as characterized by the momentum character. Bearish momentum dominates with MACD and ADX both on sell readings and Bull/Bear Power pointing to oversold conditions, despite the strong 8.79% weekly volatility. The RSI at 39.78 is approaching oversold, while Stochastic RSI is in overbought territory, highlighting a divergence in short-term momentum signals. Immediate support sits at $44.42, resistance is at $45.89, and the Ichimoku Kijun at $46.25 offers additional overhead resistance.
Downside risk remains elevated as price faces key support next week
Next week, Verizon is expected to trade between $41.74 and $46.86, with a 30% probability of an increase and a 70% chance of a decrease. The base case sees the stock holding between $44.42 support and $45.89 resistance. If shares push above $45.89, a retest of $46.25 is possible. A drop below $44.42 opens risk to the lower end of the range near $41.74.
Earlier, analysts noted that persistent technical weakness and rising sector competition posed downside risks for Verizon. While the current article highlights ongoing mixed momentum signals and recent strategic investments, traders should closely monitor the $44.42–$45.89 range as the next move out of this band may determine the short-term trend.






Latest Verizon News



-
 Afghanistan
-
 Albania
-
 Algeria
-
 Angola
-
 Argentina
-
 Armenia
-
 Australia
-
 Austria
-
 Azerbaijan
-
 Bahamas
-
 Bahrain
-
 Bangladesh
-
 Belarus
-
 Belgium
-
 Bolivia
-
 Botswana
-
 Brazil
-
 Brunei
-
 Bulgaria
-
 Cambodia
-
 Cameroon
-
 Canada
-
 Chile
-
 China
-
 Colombia
-
 Congo
-
 Costa Rica
-
 Cote d'Ivoire
-
 Croatia
-
 Cuba
-
 Cyprus
-
 Czechia
-
 DR Congo
-
 Denmark
-
 Dominican Republic
-
 Ecuador
-
 Egypt
-
 El Salvador
-
 Estonia
-
 Eswatini
-
 Ethiopia
-
 Finland
-
 France
-
 Georgia
-
 Germany
-
 Ghana
-
 Greece
-
 Haiti
-
 Hong Kong
-
 Hungary
-
 India
-
 Indonesia
-
 Iran, Islamic republic
-
 Iraq
-
 Ireland
-
 Israel
-
 Italy
-
 Jamaica
-
 Japan
-
 Jordan
-
 Kazakhstan
-
 Kenya
-
 Korea
-
 Kuwait
-
 Kyrgyzstan
-
 Laos
-
 Latvia
-
 Lebanon
-
 Lesotho
-
 Libya
-
 Lithuania
-
 Luxembourg
-
 Madagascar
-
 Malaysia
-
 Malta
-
 Mauritius
-
 Mexico
-
 Moldova
-
 Mongolia
-
 Montenegro
-
 Morocco
-
 Mozambique
-
 Myanmar
-
 Namibia
-
 Nepal
-
 Netherlands
-
 New Zealand
-
 Nigeria
-
 North Macedonia
-
 Norway
-
 Oman
-
 Pakistan
-
 Palestine
-
 Panama
-
 Papua New Guinea
-
 Paraguay
-
 Peru
-
 Philippines
-
 Poland
-
 Portugal
-
 Puerto Rico
-
 Qatar
-
 Reunion
-
 Romania
-
 Rwanda
-
 Saudi Arabia
-
 Serbia
-
 Singapore
-
 Slovakia
-
 Slovenia
-
 Somalia
-
 South Africa
-
 Spain
-
 Sri Lanka
-
 Sweden
-
 Switzerland
-
 Syria
-
 Taiwan
-
 Tajikistan
-
 Tanzania
-
 Thailand
-
 Trinidad and Tobago
-
 Tunisia
-
 Turkey
-
 UAE
-
 Uganda
-
 Ukraine
-
 United Kingdom
-
United States
-
 Uruguay
-
 Uzbekistan
-
 Venezuela
-
 Vietnam
-
 Yemen
-
 Zambia
-
 Zimbabwe
- Forex
- Crypto












