

Charles Schwab stock drops as seller pressure dominates after weak revenue results

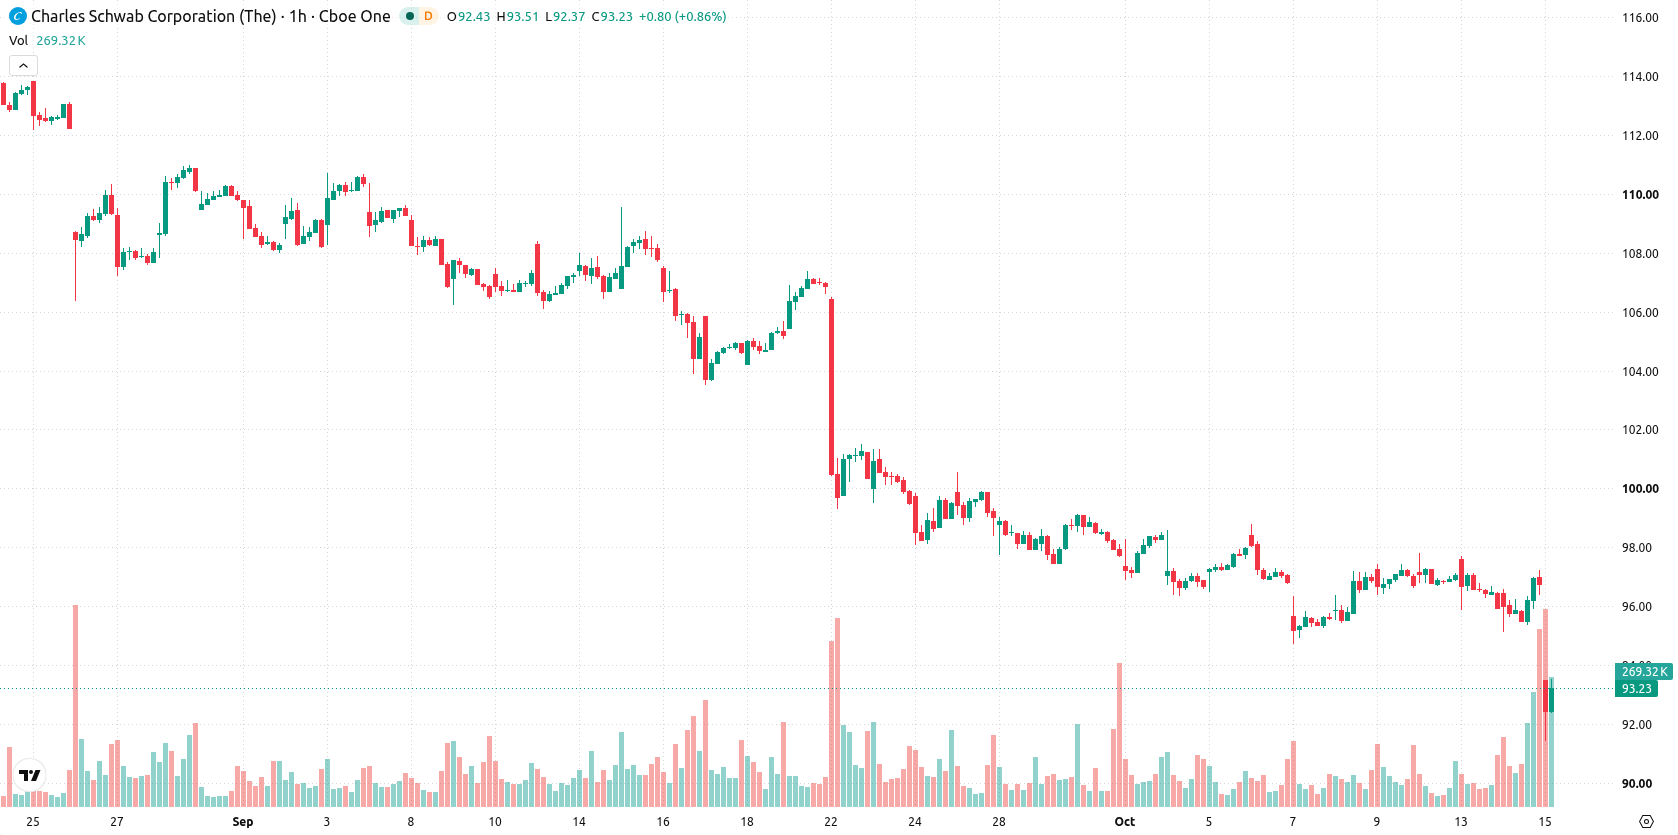
Charles Schwab (SCHW) stock is trading at $93.16, down 3.76% for the day. The price remains below its key moving averages, indicating continued seller dominance across timeframes.
 94.49
97.80
94.49
97.80
Highlights
- Charles Schwab reported adjusted earnings per share of $1.69 for Q3 2026, exceeding consensus forecasts.
- Quarterly revenue reached $7.17 billion, missing expectations as total client accounts climbed to 48.6 million.
- Shares of Charles Schwab closed at $93.16, trading below key moving averages with persistent seller momentum and an expected range of $91.93 to $94.39 for the next several sessions.
Weaker revenue outlook outweighs asset growth and fee gains
Charles Schwab reported adjusted earnings per share of $1.69 for the third quarter of 2026, exceeding consensus estimates but with revenue of $7.17 billion falling short of expectations, according to Investing.com. The revenue miss generated negative sentiment even as the company recorded $190 billion in core net new assets for the quarter, a 38% year-over-year increase that expanded total client accounts to 48.6 million, as noted by Tradingpedia. Additionally, asset management and administration fees climbed 14% annually to a record $1.9 billion in the same period, data from Benzinga showed. Despite gains in assets and fee-based revenues, the weaker revenue performance weighed on the overall market outlook, though price action has remained under broader selling pressure.
Downtrend confirmed amid layered resistance and pervasive sell signals
SCHW is trading below the MA-20 at $96.25, below the MA-50 at $96.41, and under the long-term MA-200 at $98.23, confirming short-, medium-, and long-term resistance levels. The Ichimoku Kijun sits at $94.65, now acting as immediate resistance overhead. Momentum indicators are negative: MACD and ADX both signal sell, RSI stands at 22.86 and also signals sell, and Stochastic RSI, CCI, and Bull/Bear Power all indicate oversold conditions or sustained seller dominance. Awesome Oscillator remains neutral, and there is no buy-side momentum visible across these signals.
High downside risk as tight range limits bullish prospects
For the next 2 to 3 sessions, the expected trading range for SCHW is between $91.93 and $94.39, marking the current volatility band relative to recent levels. The probability of a further decline remains very high, while the likelihood of any meaningful upward move is very low. The baseline scenario foresees price consolidating within this range, while a break above $94.65 would be required to trigger a bullish reaction. Conversely, renewed selling could be sparked by a move below the $91.93 support level.
Earlier, analysts noted that demand for pre-IPO access to select companies remains high despite inherent valuation risks prior to public listing. In the context of Charles Schwab, continued technical resistance and negative momentum indicators reinforce a prevailing downside risk, making the $91.93 support level a critical threshold to watch for potential renewed selling pressure.





Latest Charles Schwab News





-
 Afghanistan
-
 Albania
-
 Algeria
-
 Angola
-
 Argentina
-
 Armenia
-
 Australia
-
 Austria
-
 Azerbaijan
-
 Bahamas
-
 Bahrain
-
 Bangladesh
-
 Belarus
-
 Belgium
-
 Bolivia
-
 Botswana
-
 Brazil
-
 Brunei
-
 Bulgaria
-
 Cambodia
-
 Cameroon
-
 Canada
-
 Chile
Chile
-
 China
China
-
 Colombia
-
 Congo
Congo
-
 Costa Rica
-
 Cote d'Ivoire
-
 Croatia
-
 Cuba
Cuba
-
 Cyprus
-
 Czechia
-
 DR Congo
-
 Denmark
-
 Dominican Republic
-
 Ecuador
-
 Egypt
Egypt
-
 El Salvador
-
 Estonia
-
 Eswatini
-
 Ethiopia
-
 Finland
-
 France
-
 Georgia
-
 Germany
-
 Ghana
Ghana
-
 Greece
-
 Haiti
Haiti
-
 Hong Kong
-
 Hungary
-
 India
India
-
 Indonesia
-
 Iran, Islamic republic
-
 Iraq
Iraq
-
 Ireland
-
 Israel
-
 Italy
Italy
-
 Jamaica
-
 Japan
Japan
-
 Jordan
-
 Kazakhstan
-
 Kenya
Kenya
-
 Korea
Korea
-
 Kuwait
-
 Kyrgyzstan
-
 Laos
Laos
-
 Latvia
-
 Lebanon
-
 Lesotho
-
 Libya
Libya
-
 Lithuania
-
 Luxembourg
-
 Madagascar
-
 Malaysia
-
 Malta
Malta
-
 Mauritius
-
 Mexico
-
 Moldova
-
 Mongolia
-
 Montenegro
-
 Morocco
-
 Mozambique
-
 Myanmar
-
 Namibia
-
 Nepal
Nepal
-
 Netherlands
-
 New Zealand
-
 Nigeria
-
 North Macedonia
-
 Norway
-
 Oman
Oman
-
 Pakistan
-
 Palestine
-
 Panama
-
 Papua New Guinea
-
 Paraguay
-
 Peru
Peru
-
 Philippines
-
 Poland
-
 Portugal
-
 Puerto Rico
-
 Qatar
Qatar
-
 Reunion
-
 Romania
-
 Rwanda
-
 Saudi Arabia
-
 Serbia
-
 Singapore
-
 Slovakia
-
 Slovenia
-
 Somalia
-
 South Africa
-
 Spain
Spain
-
 Sri Lanka
-
 Sweden
-
 Switzerland
-
 Syria
Syria
-
 Taiwan
-
 Tajikistan
-
 Tanzania
-
 Thailand
-
 Trinidad and Tobago
-
 Tunisia
-
 Turkey
-
 UAE
UAE
-
 Uganda
-
 Ukraine
-
 United Kingdom
-
United States
-
 Uruguay
-
 Uzbekistan
-
 Venezuela
-
 Vietnam
-
 Yemen
Yemen
-
 Zambia
-
 Zimbabwe
- Forex
- Crypto












