


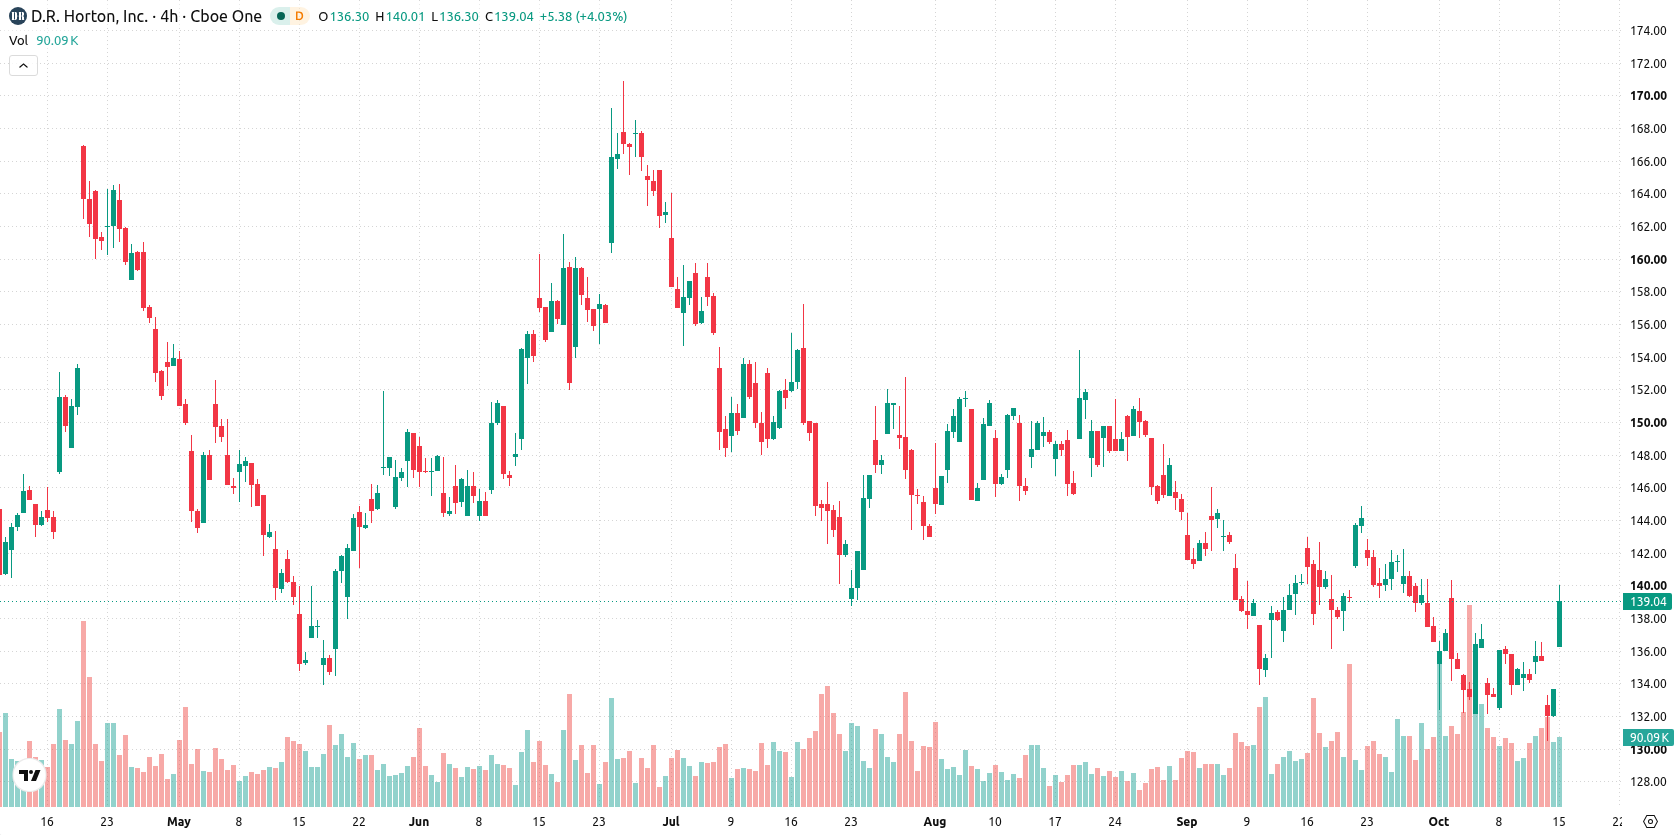
DR Horton Inc (DHI) surged 4.18% in a strong upward move, driven mainly by a short-term technical rebound as no new company developments or market catalysts were reported. The quality of the move looks limited, with the stock held back by its position below both the 50-day and 200-day moving averages.
 142.90
142.76
142.90
142.76
Highlights
- DR Horton stock trades just above short-term support at $137.62, but remains pressured by medium- and long-term resistance levels.
- Technical momentum is weak overall, with MACD, RSI, and other oscillators indicating prevailing selling pressure and intraday oversold conditions.
- The expected five-day range is $135.96 to $146.43, with an 80% probability of a downward move and limited upside risk.
Mixed technical momentum as short-term strength meets longer-term pressure
DR Horton is trading above its 20-day moving average at $137.42, but remains below the 50-day and 200-day moving averages at $142.13 and $147.97, respectively. This positions the stock with some short-term strength, while medium- and long-term signals indicate seller pressure, in line with a bearish overall technical picture. The nearest support is at $137.62 (Ichimoku Kijun), and the closest resistance is today's high at $140.11. Momentum is mixed—while the MACD and RSI point to selling pressure, the ADX reflects weak trend strength. Both the RSI and Stochastic RSI forecast sell conditions, and the CCI and Bull/Bear Power suggest an oversold state, with BBP confirming intraday seller dominance.
Previously it was reported that DR Horton faced mixed technical signals, with short-term strength offset by selling pressure from institutional investors and overall bearish momentum. The current analysis reinforces this cautious stance, highlighting a very high probability of a downside move in the coming sessions, with support at $137.62 as the key level to monitor.





Latest DR Horton Inc News






-
 Afghanistan
-
 Albania
-
 Algeria
-
 Angola
-
 Argentina
-
 Armenia
-
 Australia
-
 Austria
-
 Azerbaijan
-
 Bahamas
-
 Bahrain
-
 Bangladesh
-
 Belarus
-
 Belgium
-
 Bolivia
-
 Botswana
-
 Brazil
-
 Brunei
-
 Bulgaria
-
 Cambodia
-
 Cameroon
-
 Canada
-
 Chile
Chile
-
 China
China
-
 Colombia
-
 Congo
Congo
-
 Costa Rica
-
 Cote d'Ivoire
-
 Croatia
-
 Cuba
Cuba
-
 Cyprus
-
 Czechia
-
 DR Congo
-
 Denmark
-
 Dominican Republic
-
 Ecuador
-
 Egypt
Egypt
-
 El Salvador
-
 Estonia
-
 Eswatini
-
 Ethiopia
-
 Finland
-
 France
-
 Georgia
-
 Germany
-
 Ghana
Ghana
-
 Greece
-
 Haiti
Haiti
-
 Hong Kong
-
 Hungary
-
 India
India
-
 Indonesia
-
 Iran, Islamic republic
-
 Iraq
Iraq
-
 Ireland
-
 Israel
-
 Italy
Italy
-
 Jamaica
-
 Japan
Japan
-
 Jordan
-
 Kazakhstan
-
 Kenya
Kenya
-
 Korea
Korea
-
 Kuwait
-
 Kyrgyzstan
-
 Laos
Laos
-
 Latvia
-
 Lebanon
-
 Lesotho
-
 Libya
Libya
-
 Lithuania
-
 Luxembourg
-
 Madagascar
-
 Malaysia
-
 Malta
Malta
-
 Mauritius
-
 Mexico
-
 Moldova
-
 Mongolia
-
 Montenegro
-
 Morocco
-
 Mozambique
-
 Myanmar
-
 Namibia
-
 Nepal
Nepal
-
 Netherlands
-
 New Zealand
-
 Nigeria
-
 North Macedonia
-
 Norway
-
 Oman
Oman
-
 Pakistan
-
 Palestine
-
 Panama
-
 Papua New Guinea
-
 Paraguay
-
 Peru
Peru
-
 Philippines
-
 Poland
-
 Portugal
-
 Puerto Rico
-
 Qatar
Qatar
-
 Reunion
-
 Romania
-
 Rwanda
-
 Saudi Arabia
-
 Serbia
-
 Singapore
-
 Slovakia
-
 Slovenia
-
 Somalia
-
 South Africa
-
 Spain
Spain
-
 Sri Lanka
-
 Sweden
-
 Switzerland
-
 Syria
Syria
-
 Taiwan
-
 Tajikistan
-
 Tanzania
-
 Thailand
-
 Trinidad and Tobago
-
 Tunisia
-
 Turkey
-
 UAE
UAE
-
 Uganda
-
 Ukraine
-
 United Kingdom
-
United States
-
 Uruguay
-
 Uzbekistan
-
 Venezuela
-
 Vietnam
-
 Yemen
Yemen
-
 Zambia
-
 Zimbabwe
- Forex
- Crypto












