

AgEagle shares technical analysis: Upward price move runs into $0.74 resistance

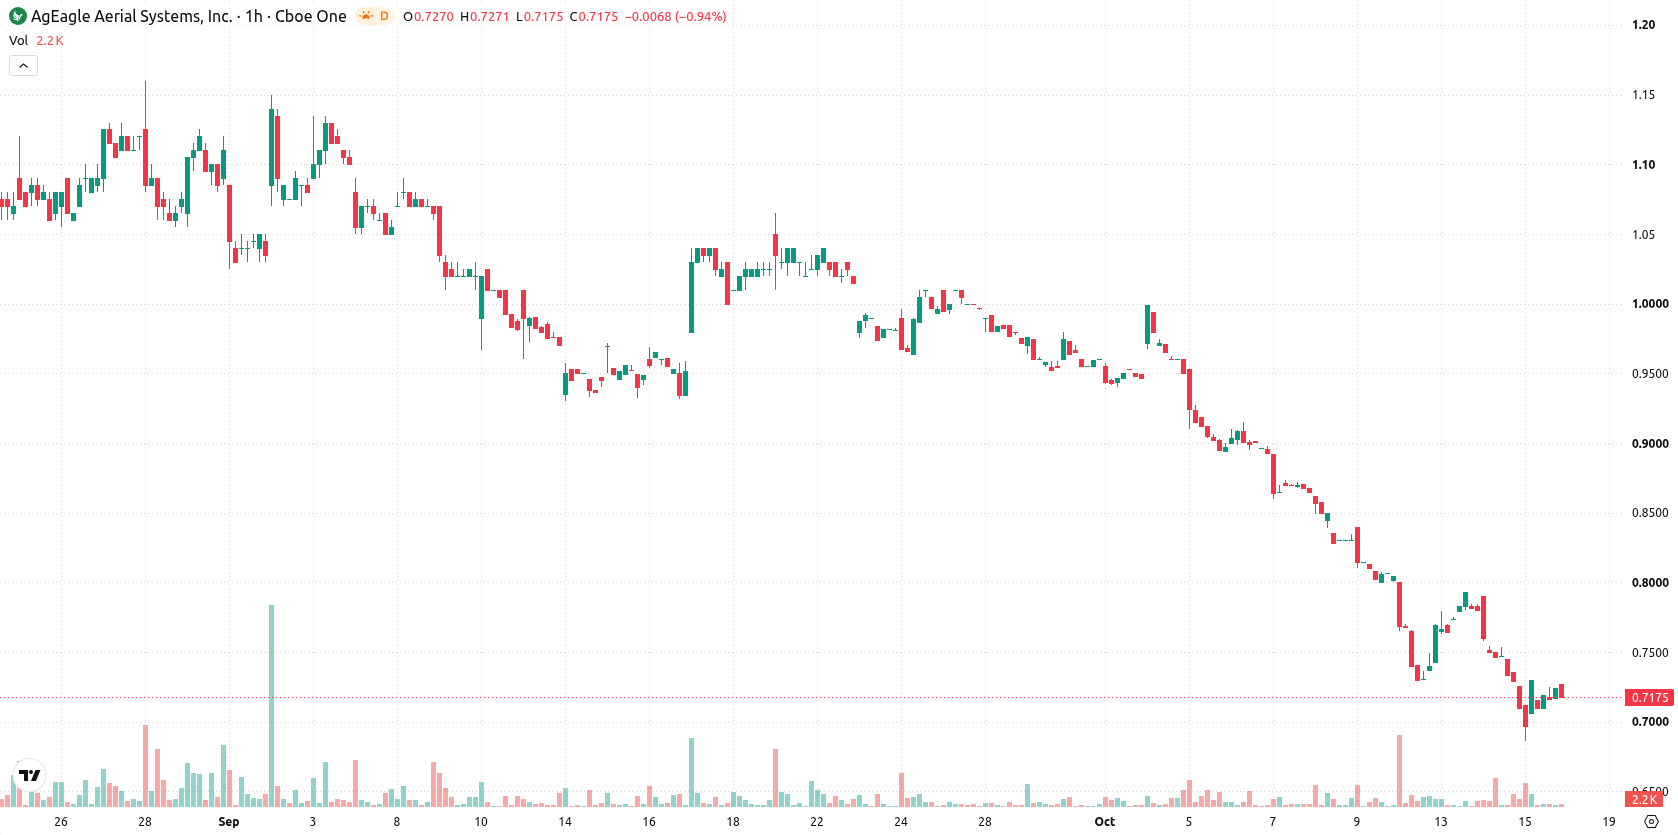
AgEagle (UAVS) stock is trading at $0.7288, up 2.72% on the day. The price remains below its key moving averages.
 0.75
0.8015
0.75
0.8015
Highlights
- UAVS/USD trades below key moving averages, maintaining a bearish long-term structure with persistent seller pressure.
- Multiple indicators confirm downside momentum, with negative signals from MACD, ADX, and CCI, and a range-bound short-term stance.
- For the next 2 to 3 days, price is expected to remain between $0.66 and $0.80, with upward move probability at 36% and stronger risk to the downside.
Bearish momentum reinforced as technical indicators diverge
On the H1 chart, the price is trading below the MA-20 at $0.74 and the MA-50 at $0.79. It also sits below the MA-200 at $1.01 on the daily timeframe. The Ichimoku Kijun level at $0.74 is immediate resistance. Momentum indicators reinforce seller pressure: MACD and ADX both show a sell bias, and RSI is subdued at 40.88 while CCI continues in sell mode. Stoch RSI is overbought, indicating a possible short-term pullback. Bull/Bear Power reveals some intraday buyer strength that diverges from the wider negative momentum backdrop. The Awesome Oscillator remains neutral.
Downside risk dominates as volatility defines trading range
Over the next 2–3 trading days, UAVS is expected to trade within a volatility band between $0.66 and $0.80. The probability of an upward move is 36%, while a downward move is more likely at 64%. Price action will likely remain range-bound; a close above $0.74 would open up a bullish scenario, whereas a break below $0.66 would mark renewed bearish momentum.
Earlier, analysts noted that AgEagle stock continued to exhibit persistent technical weakness and strong selling pressure. The current analysis confirms this overall bearish outlook, highlighting that traders should monitor the $0.74 resistance and $0.66 support as pivotal levels for determining the next directional move.









-
 Afghanistan
-
 Albania
-
 Algeria
-
 Angola
-
 Argentina
-
 Armenia
-
 Australia
-
 Austria
-
 Azerbaijan
-
 Bahamas
-
 Bahrain
-
 Bangladesh
-
 Belarus
-
 Belgium
-
 Bolivia
-
 Botswana
-
 Brazil
-
 Brunei
-
 Bulgaria
-
 Cambodia
-
 Cameroon
-
 Canada
-
 Chile
Chile
-
 China
China
-
 Colombia
-
 Congo
Congo
-
 Costa Rica
-
 Cote d'Ivoire
-
 Croatia
-
 Cuba
Cuba
-
 Cyprus
-
 Czechia
-
 DR Congo
-
 Denmark
-
 Dominican Republic
-
 Ecuador
-
 Egypt
Egypt
-
 El Salvador
-
 Estonia
-
 Eswatini
-
 Ethiopia
-
 Finland
-
 France
-
 Georgia
-
 Germany
-
 Ghana
Ghana
-
 Greece
-
 Haiti
Haiti
-
 Hong Kong
-
 Hungary
-
 India
India
-
 Indonesia
-
 Iran, Islamic republic
-
 Iraq
Iraq
-
 Ireland
-
 Israel
-
 Italy
Italy
-
 Jamaica
-
 Japan
Japan
-
 Jordan
-
 Kazakhstan
-
 Kenya
Kenya
-
 Korea
Korea
-
 Kuwait
-
 Kyrgyzstan
-
 Laos
Laos
-
 Latvia
-
 Lebanon
-
 Lesotho
-
 Libya
Libya
-
 Lithuania
-
 Luxembourg
-
 Madagascar
-
 Malaysia
-
 Malta
Malta
-
 Mauritius
-
 Mexico
-
 Moldova
-
 Mongolia
-
 Montenegro
-
 Morocco
-
 Mozambique
-
 Myanmar
-
 Namibia
-
 Nepal
Nepal
-
 Netherlands
-
 New Zealand
-
 Nigeria
-
 North Macedonia
-
 Norway
-
 Oman
Oman
-
 Pakistan
-
 Palestine
-
 Panama
-
 Papua New Guinea
-
 Paraguay
-
 Peru
Peru
-
 Philippines
-
 Poland
-
 Portugal
-
 Puerto Rico
-
 Qatar
Qatar
-
 Reunion
-
 Romania
-
 Rwanda
-
 Saudi Arabia
-
 Serbia
-
 Singapore
-
 Slovakia
-
 Slovenia
-
 Somalia
-
 South Africa
-
 Spain
Spain
-
 Sri Lanka
-
 Sweden
-
 Switzerland
-
 Syria
Syria
-
 Taiwan
-
 Tajikistan
-
 Tanzania
-
 Thailand
-
 Trinidad and Tobago
-
 Tunisia
-
 Turkey
-
 UAE
UAE
-
 Uganda
-
 Ukraine
-
 United Kingdom
-
United States
-
 Uruguay
-
 Uzbekistan
-
 Venezuela
-
 Vietnam
-
 Yemen
Yemen
-
 Zambia
-
 Zimbabwe
- Forex
- Crypto












