

Will TSLA hold its current range amid seller dominance and weak momentum?

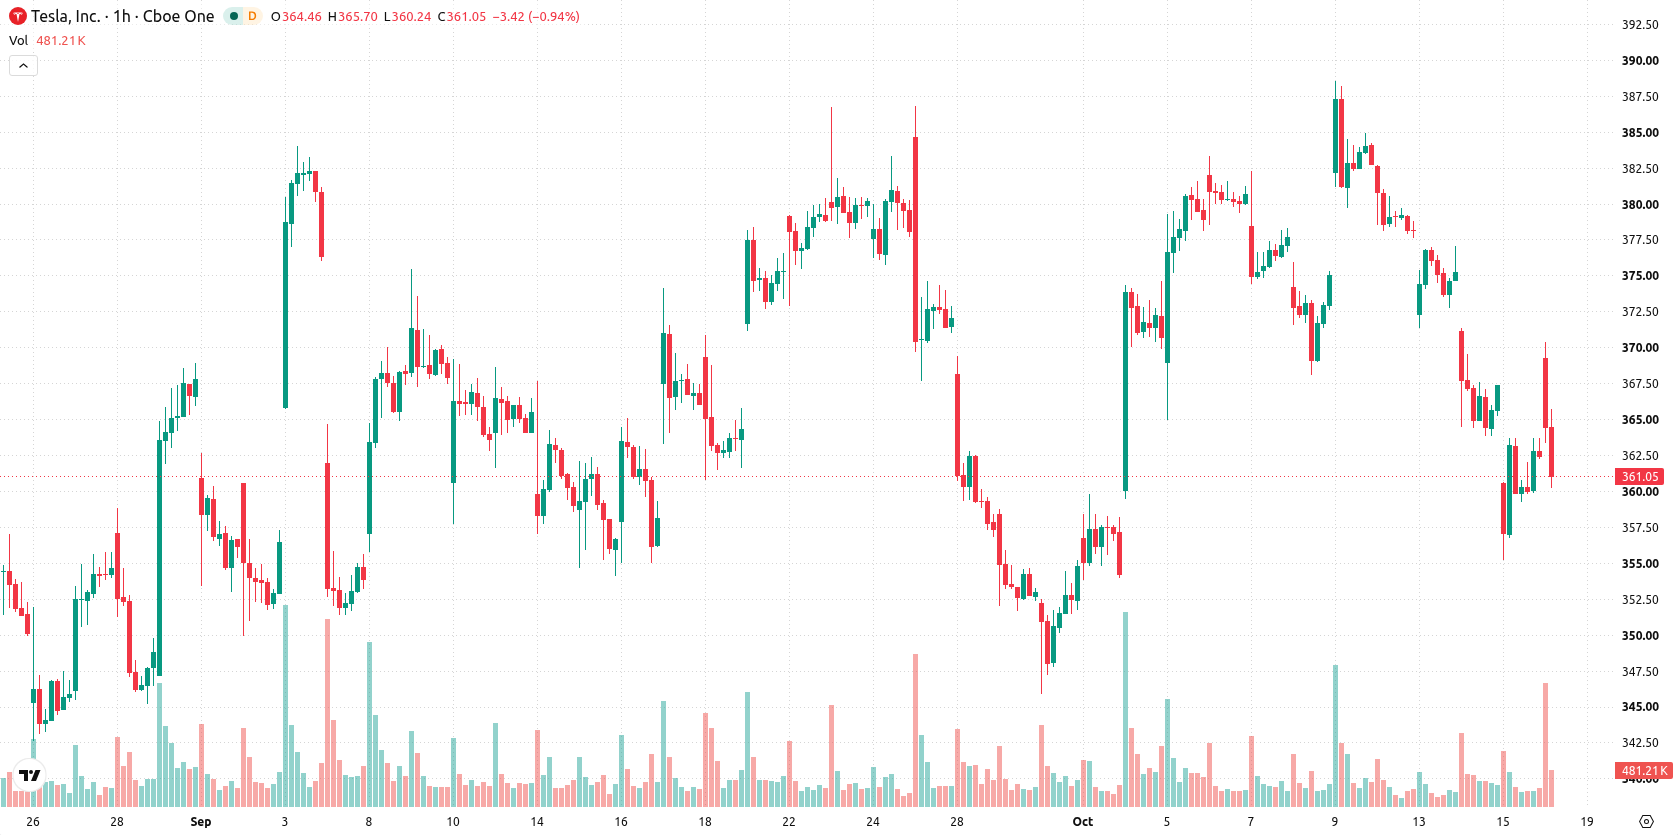
Tesla (TSLA) stock is trading at $364.28 following a modest gain for the session. The price sits below its key moving averages, pointing to a period of muted momentum relative to recent trends.
 395.85
401.16
Highlights
- Tesla unveiled a redesigned Roadster sports car with compressed air propulsion and 0 to 60 mph acceleration in 0.81 seconds.
- Tesla reported Q3 2026 deliveries of 486,532 vehicles, topping consensus but showing a 2.1% year-over-year decline.
- Tesla stock trades below key moving averages with technical signals biased bearish and is expected to range between $352.12 and $376.44.
Engineering innovation and delivery beats drive renewed investor interest
Tesla unveiled its redesigned Roadster electric sports car with limited flight capabilities during a live event at SpaceX’s McGregor, Texas facility, highlighting compressed air propulsion and exceptional acceleration from 0 to 60 mph in 0.81 seconds, according to Yahoo Finance. This high-profile demonstration showcased the company's continued push for innovation, attracting attention to its engineering advancements and expanding product appeal. In addition, Tesla reported Q3 2026 deliveries of 486,532 vehicles, surpassing consensus expectations but reflecting a 2.1% year-over-year decline, as reported by Seeking Alpha. The introduction of the Roadster in several high-performance variants further broadens Tesla’s premium segment presence and contributes to ongoing market interest.
Seller dominance emerges as prices straddle major technical barriers
TSLA is trading below the MA-20 and MA-50 on the hourly chart, with the daily price also under the MA-200. The Ichimoku Kijun serves as immediate resistance at $367.46. On the indicators side, MACD and ADX both register strong sell momentum, while RSI reads 40.27, leaning into bearish territory. Stochastic RSI remains in overbought territory, the Commodity Channel Index continues to signal a sell, and Bull/Bear Power is oversold, indicating seller dominance. The Awesome Oscillator is neutral, offering no confirmation of the current trend.
Downside risk favored amid extended range-bound volatility
Over the short term, TSLA is likely to remain within a range of $352.12 to $376.44, as recent volatility keeps price action confined. The baseline scenario sees consolidation within this band unless a decisive push beyond the $367.46 resistance initiates a breakout to the upside. Conversely, a move below the lower boundary could accelerate downside, with event-driven or technical factors steering the next leg. Probability estimations favor continuation of current conditions, with a 62% chance of a downward move compared to 38% for a breakout higher.
Earlier, analysts noted that merger speculation between Tesla and SpaceX was intensifying amid shifting prediction market odds and increased collaborative activity. The current technical picture highlights a prevailing consolidation phase for Tesla shares, with traders advised to monitor the $367.46 resistance for signs of a potential breakout or further downside risk should the lower boundary give way.











-
 Afghanistan
-
 Albania
-
 Algeria
-
 Angola
-
 Argentina
-
 Armenia
-
 Australia
-
 Austria
-
 Azerbaijan
-
 Bahamas
-
 Bahrain
-
 Bangladesh
-
 Belarus
-
 Belgium
-
 Bolivia
-
 Botswana
-
 Brazil
-
 Brunei
-
 Bulgaria
-
 Cambodia
-
 Cameroon
-
 Canada
-
 Chile
-
 China
-
 Colombia
-
 Congo
-
 Costa Rica
-
 Cote d'Ivoire
-
 Croatia
-
 Cuba
-
 Cyprus
-
 Czechia
-
 DR Congo
-
 Denmark
-
 Dominican Republic
-
 Ecuador
-
 Egypt
-
 El Salvador
-
 Estonia
-
 Eswatini
-
 Ethiopia
-
 Finland
-
 France
-
 Georgia
-
 Germany
-
 Ghana
-
 Greece
-
 Haiti
-
 Hong Kong
-
 Hungary
-
 India
-
 Indonesia
-
 Iran, Islamic republic
-
 Iraq
-
 Ireland
-
 Israel
-
 Italy
-
 Jamaica
-
 Japan
-
 Jordan
-
 Kazakhstan
-
 Kenya
-
 Korea
-
 Kuwait
-
 Kyrgyzstan
-
 Laos
-
 Latvia
-
 Lebanon
-
 Lesotho
-
 Libya
-
 Lithuania
-
 Luxembourg
-
 Madagascar
-
 Malaysia
-
 Malta
-
 Mauritius
-
 Mexico
-
 Moldova
-
 Mongolia
-
 Montenegro
-
 Morocco
-
 Mozambique
-
 Myanmar
-
 Namibia
-
 Nepal
-
 Netherlands
-
 New Zealand
-
 Nigeria
-
 North Macedonia
-
 Norway
-
 Oman
-
 Pakistan
-
 Palestine
-
 Panama
-
 Papua New Guinea
-
 Paraguay
-
 Peru
-
 Philippines
-
 Poland
-
 Portugal
-
 Puerto Rico
-
 Qatar
-
 Reunion
-
 Romania
-
 Rwanda
-
 Saudi Arabia
-
 Serbia
-
 Singapore
-
 Slovakia
-
 Slovenia
-
 Somalia
-
 South Africa
-
 Spain
-
 Sri Lanka
-
 Sweden
-
 Switzerland
-
 Syria
-
 Taiwan
-
 Tajikistan
-
 Tanzania
-
 Thailand
-
 Trinidad and Tobago
-
 Tunisia
-
 Turkey
-
 UAE
-
 Uganda
-
 Ukraine
-
 United Kingdom
-
United States
-
 Uruguay
-
 Uzbekistan
-
 Venezuela
-
 Vietnam
-
 Yemen
-
 Zambia
-
 Zimbabwe
- Forex
- Crypto












