

AMD shares technical analysis: Downward price move dominates as sellers hold control

AMD (AMD) stock is trading at $549.33, down 2.29% on the day. The price currently sits below its key moving averages but remains above longer-term average levels.
 550.10
606.18
550.10
606.18
Highlights
- Shares of AMD have twice crossed above $600 recently but failed to sustain that level due to overhead supply and profit-taking.
- Repeated inability to stay above key resistance may keep trading cautious in the near term.
- AMD stock remains under short-term selling pressure, with downside expected and a trading range of $515.3 to $584.44 in the coming days.
Cautious sentiment as repeated $600 failures trigger selling pressure
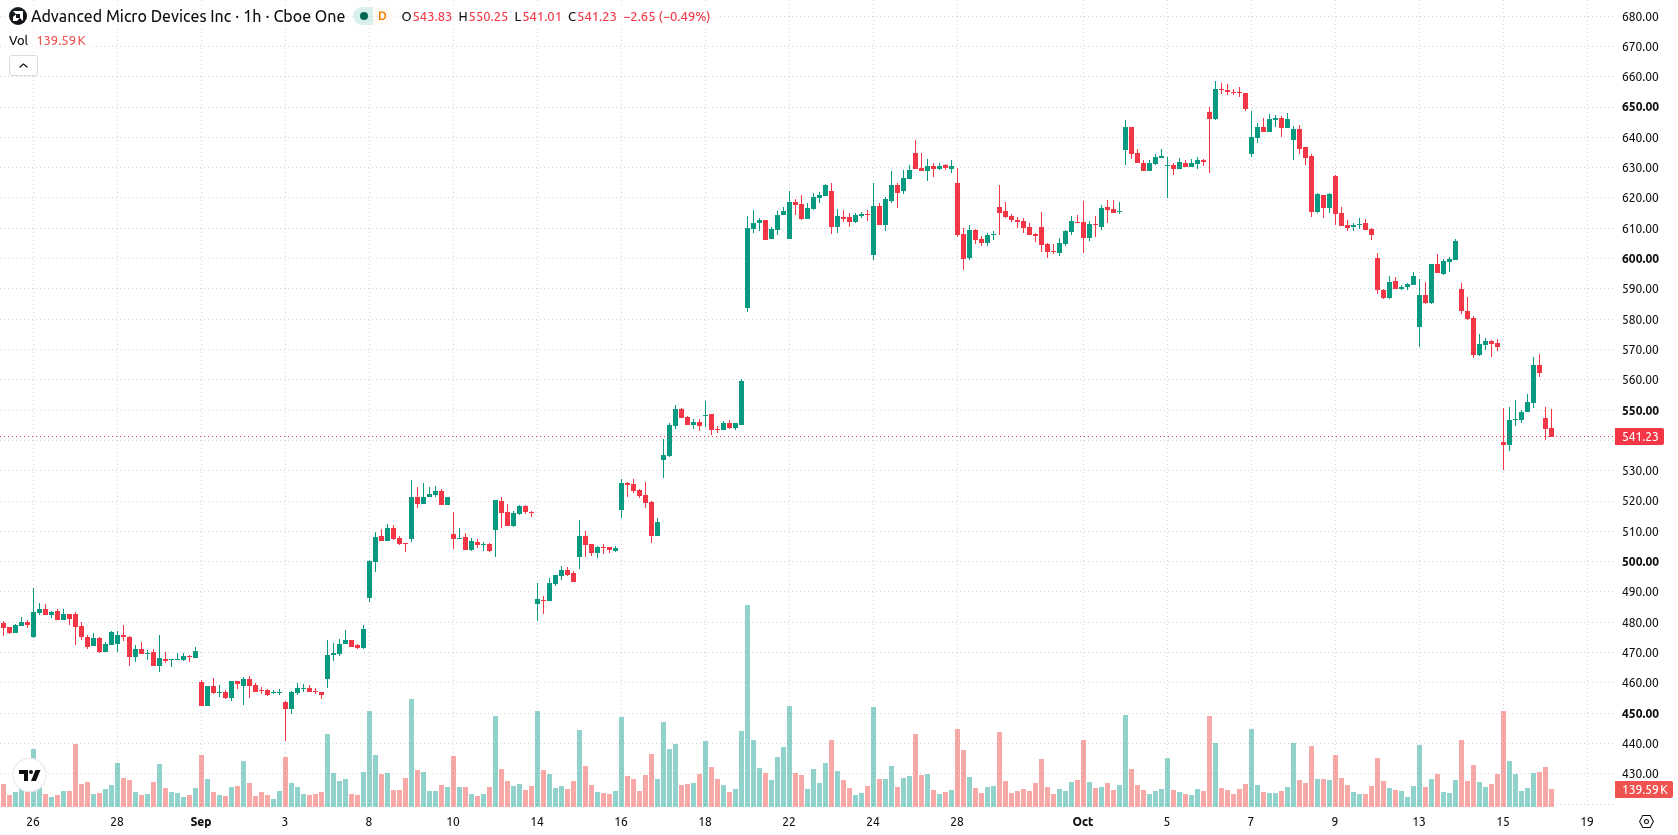
According to 247wallst, AMD has twice surpassed the $600 price level in recent trading sessions but was unable to maintain its position above this key threshold. This recurring failure to hold higher levels indicates the presence of consistent overhead supply or profit-taking activity, which can contribute to continued selling pressure. As a result, investor sentiment may remain cautious in the short term.
Bearish momentum confirmed by moving average barriers and oscillators
On the H1 chart, AMD is trading below the MA-20 at $572.78 and the MA-50 at $597.81, while remaining above the MA-200 at $392.66. The daily Ichimoku Kijun is positioned at $569.04, acting as immediate resistance. Among oscillators, the MACD points to a strong sell signal, ADX supports a bearish bias, and RSI is at 40.94, consistent with selling conditions. Stochastic RSI and Bull/Bear Power indicate overbought intraday readings, while CCI and the Awesome Oscillator are currently neutral, offering no clear trend confirmation.
Limited upside as volatility favors sideways or downward price action
Over the next several trading days, AMD is expected to move within a price range of $515.3 to $584.44 based on typical volatility. The probability of a move to the upside is very low, while a downtrend remains highly likely. The baseline expectation is sideways movement in a horizontal corridor between major support and resistance. Should AMD break above the $569.04 resistance, upside targets may come into play, while a drop below $515.3 would confirm renewed selling and put new short-term lows in focus.
Earlier, analysts noted that AMD faced strong downside risk amid persistent selling pressure and technical weakness. The latest analysis affirms this bearish outlook, highlighting that continued failure to reclaim resistance now makes the $515.3 level a critical support for traders to monitor in the sessions ahead.











-
 Afghanistan
-
 Albania
-
 Algeria
-
 Angola
-
 Argentina
-
 Armenia
-
 Australia
-
 Austria
-
 Azerbaijan
-
 Bahamas
-
 Bahrain
-
 Bangladesh
-
 Belarus
-
 Belgium
-
 Bolivia
-
 Botswana
-
 Brazil
-
 Brunei
-
 Bulgaria
-
 Cambodia
-
 Cameroon
-
 Canada
-
 Chile
Chile
-
 China
China
-
 Colombia
-
 Congo
Congo
-
 Costa Rica
-
 Cote d'Ivoire
-
 Croatia
-
 Cuba
Cuba
-
 Cyprus
-
 Czechia
-
 DR Congo
-
 Denmark
-
 Dominican Republic
-
 Ecuador
-
 Egypt
Egypt
-
 El Salvador
-
 Estonia
-
 Eswatini
-
 Ethiopia
-
 Finland
-
 France
-
 Georgia
-
 Germany
-
 Ghana
Ghana
-
 Greece
-
 Haiti
Haiti
-
 Hong Kong
-
 Hungary
-
 India
India
-
 Indonesia
-
 Iran, Islamic republic
-
 Iraq
Iraq
-
 Ireland
-
 Israel
-
 Italy
Italy
-
 Jamaica
-
 Japan
Japan
-
 Jordan
-
 Kazakhstan
-
 Kenya
Kenya
-
 Korea
Korea
-
 Kuwait
-
 Kyrgyzstan
-
 Laos
Laos
-
 Latvia
-
 Lebanon
-
 Lesotho
-
 Libya
Libya
-
 Lithuania
-
 Luxembourg
-
 Madagascar
-
 Malaysia
-
 Malta
Malta
-
 Mauritius
-
 Mexico
-
 Moldova
-
 Mongolia
-
 Montenegro
-
 Morocco
-
 Mozambique
-
 Myanmar
-
 Namibia
-
 Nepal
Nepal
-
 Netherlands
-
 New Zealand
-
 Nigeria
-
 North Macedonia
-
 Norway
-
 Oman
Oman
-
 Pakistan
-
 Palestine
-
 Panama
-
 Papua New Guinea
-
 Paraguay
-
 Peru
Peru
-
 Philippines
-
 Poland
-
 Portugal
-
 Puerto Rico
-
 Qatar
Qatar
-
 Reunion
-
 Romania
-
 Rwanda
-
 Saudi Arabia
-
 Serbia
-
 Singapore
-
 Slovakia
-
 Slovenia
-
 Somalia
-
 South Africa
-
 Spain
Spain
-
 Sri Lanka
-
 Sweden
-
 Switzerland
-
 Syria
Syria
-
 Taiwan
-
 Tajikistan
-
 Tanzania
-
 Thailand
-
 Trinidad and Tobago
-
 Tunisia
-
 Turkey
-
 UAE
UAE
-
 Uganda
-
 Ukraine
-
 United Kingdom
-
United States
-
 Uruguay
-
 Uzbekistan
-
 Venezuela
-
 Vietnam
-
 Yemen
Yemen
-
 Zambia
-
 Zimbabwe
- Forex
- Crypto












