

NFLX drops as momentum weakens in overbought territory

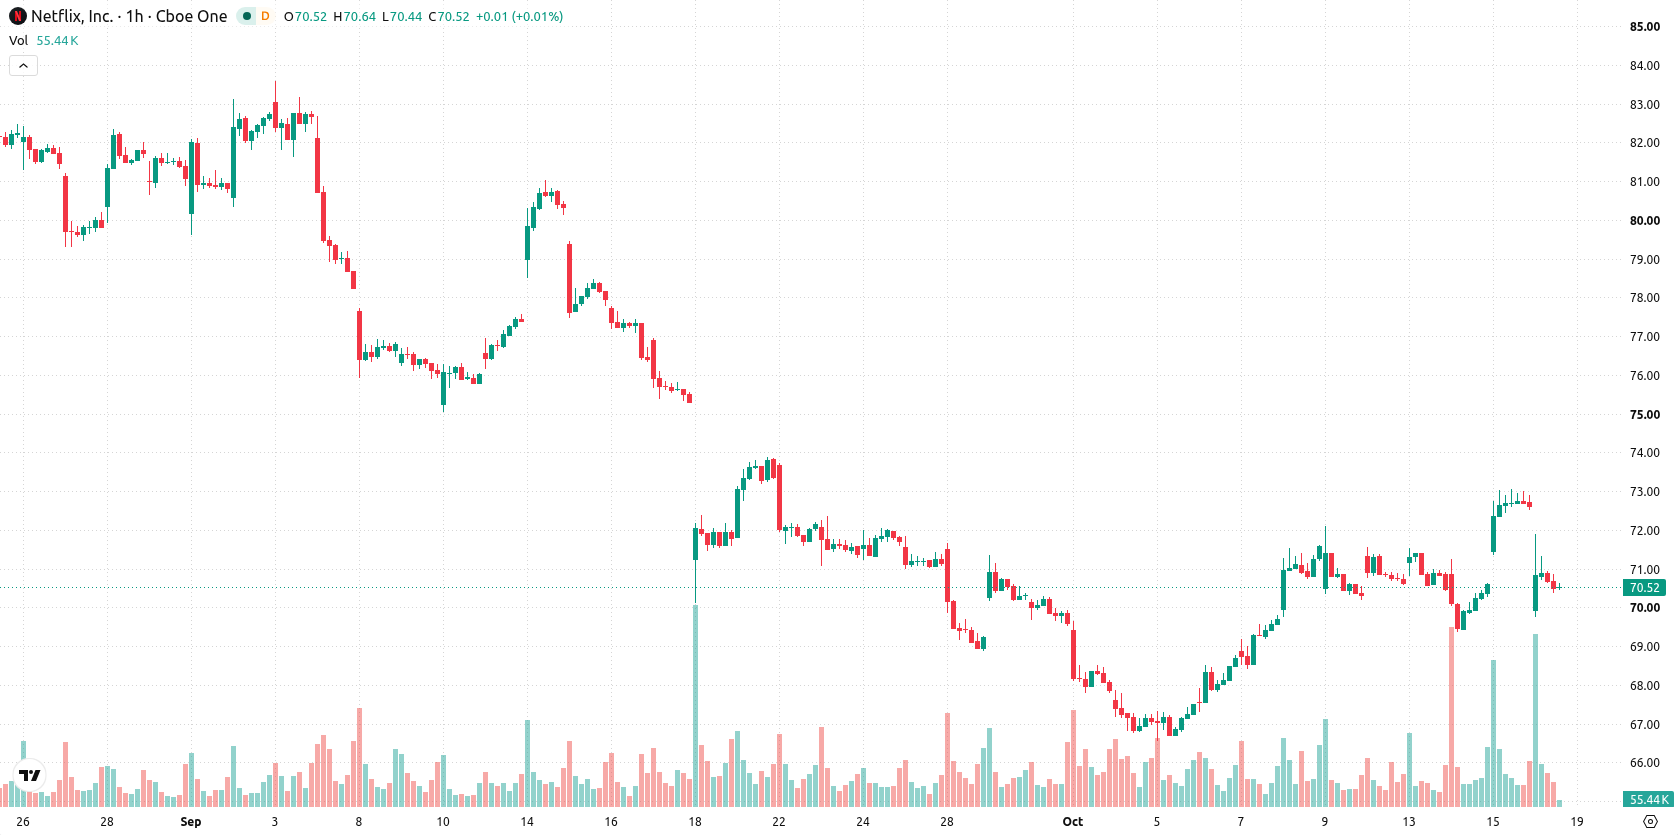
Netflix (NFLX) stock is trading at $70.23 after a 3.28% decline on the day, reflecting a move near the low end of its intraday range. The price remains positioned below its key moving averages, pointing to continued weakness in the short and medium term.
 63.05
65.35
Highlights
- Netflix will cut about 1,000 jobs, roughly 6% of staff, reducing expenses across product, technology, legal, and human resources.
- Leadership transitions include Peter Rice assuming the Chief Content Officer role on October 26, 2026, with the third-quarter 2026 earnings due October 20.
- Shares of Netflix trade below key moving averages with a bearish technical setup, projected to range between $68.59 and $71.87, and a 68% probability of a downward move.
Cost cuts and leadership changes underscore investor caution amid restructuring
Netflix has announced a workforce reduction of about 1,000 jobs, or roughly 6% of its staff, with the majority of cuts impacting product, technology, legal, and human resources departments, according to Ibtimes Co. This significant restructuring reduces operational expenses in the near term and highlights management's efforts to navigate business headwinds, which can prompt caution among investors during periods of strategic reassessment. Additionally, leadership changes are set to take place as Peter Rice, formerly of Disney, will become Chief Content Officer on October 26, 2026, following a nearly decade-long tenure by Bela Bajaria, as reported by Gurufocus, while anticipation is building around the company's scheduled third-quarter 2026 earnings release on October 20, 2026, according to Tipranks.
Mixed momentum as buyers meet technical resistance near intraday highs
Technically, NFLX trades below the MA-20 at $71.2 and the MA-50 at $70.74 on the hourly chart, with the long-term MA-200 higher at $83. Immediate resistance is set by the Ichimoku Kijun at $71.22. Momentum signals from MACD and ADX indicate bullish pressure, yet this is offset by divergence in oscillators: RSI is on Buy, but both Stochastic RSI and Bull/Bear Power display overbought conditions, while CCI also shows a buy reading. Bull/Bear Power points to intraday buyer dominance, yet the Awesome Oscillator remains unconfirmed, reflecting mixed conviction across indicators.
Downside risk prevails as volatility guides consolidation scenario
In the short term, NFLX is projected to range between $68.59 and $71.87 over the next several sessions, with a 32% likelihood of an upward break versus a 68% chance of a further move down. The most likely scenario is continued consolidation within current support and resistance. A clear bullish trigger would be a sustained move above the $71.22 resistance, while a breakdown below $68.59 could accelerate downside momentum in line with the prevailing volatility band.
Previously it was reported that Netflix undertook significant leadership changes and workforce reductions as part of broader efforts to adapt to evolving industry pressures. The latest technical signals and restructuring details support the view that traders should closely monitor the $68.59 support level, as a breach here could present enhanced downside risk in the near term.











-
 Afghanistan
-
 Albania
-
 Algeria
-
 Angola
-
 Argentina
-
 Armenia
-
 Australia
-
 Austria
-
 Azerbaijan
-
 Bahamas
-
 Bahrain
-
 Bangladesh
-
 Belarus
-
 Belgium
-
 Bolivia
-
 Botswana
-
 Brazil
-
 Brunei
-
 Bulgaria
-
 Cambodia
-
 Cameroon
-
 Canada
-
 Chile
-
 China
-
 Colombia
-
 Congo
-
 Costa Rica
-
 Cote d'Ivoire
-
 Croatia
-
 Cuba
-
 Cyprus
-
 Czechia
-
 DR Congo
-
 Denmark
-
 Dominican Republic
-
 Ecuador
-
 Egypt
-
 El Salvador
-
 Estonia
-
 Eswatini
-
 Ethiopia
-
 Finland
-
 France
-
 Georgia
-
 Germany
-
 Ghana
-
 Greece
-
 Haiti
-
 Hong Kong
-
 Hungary
-
 India
-
 Indonesia
-
 Iran, Islamic republic
-
 Iraq
-
 Ireland
-
 Israel
-
 Italy
-
 Jamaica
-
 Japan
-
 Jordan
-
 Kazakhstan
-
 Kenya
-
 Korea
-
 Kuwait
-
 Kyrgyzstan
-
 Laos
-
 Latvia
-
 Lebanon
-
 Lesotho
-
 Libya
-
 Lithuania
-
 Luxembourg
-
 Madagascar
-
 Malaysia
-
 Malta
-
 Mauritius
-
 Mexico
-
 Moldova
-
 Mongolia
-
 Montenegro
-
 Morocco
-
 Mozambique
-
 Myanmar
-
 Namibia
-
 Nepal
-
 Netherlands
-
 New Zealand
-
 Nigeria
-
 North Macedonia
-
 Norway
-
 Oman
-
 Pakistan
-
 Palestine
-
 Panama
-
 Papua New Guinea
-
 Paraguay
-
 Peru
-
 Philippines
-
 Poland
-
 Portugal
-
 Puerto Rico
-
 Qatar
-
 Reunion
-
 Romania
-
 Rwanda
-
 Saudi Arabia
-
 Serbia
-
 Singapore
-
 Slovakia
-
 Slovenia
-
 Somalia
-
 South Africa
-
 Spain
-
 Sri Lanka
-
 Sweden
-
 Switzerland
-
 Syria
-
 Taiwan
-
 Tajikistan
-
 Tanzania
-
 Thailand
-
 Trinidad and Tobago
-
 Tunisia
-
 Turkey
-
 UAE
-
 Uganda
-
 Ukraine
-
 United Kingdom
-
United States
-
 Uruguay
-
 Uzbekistan
-
 Venezuela
-
 Vietnam
-
 Yemen
-
 Zambia
-
 Zimbabwe
- Forex
- Crypto












