

AFRM drops as October 2026 US inflation surprise heightens downside pressure

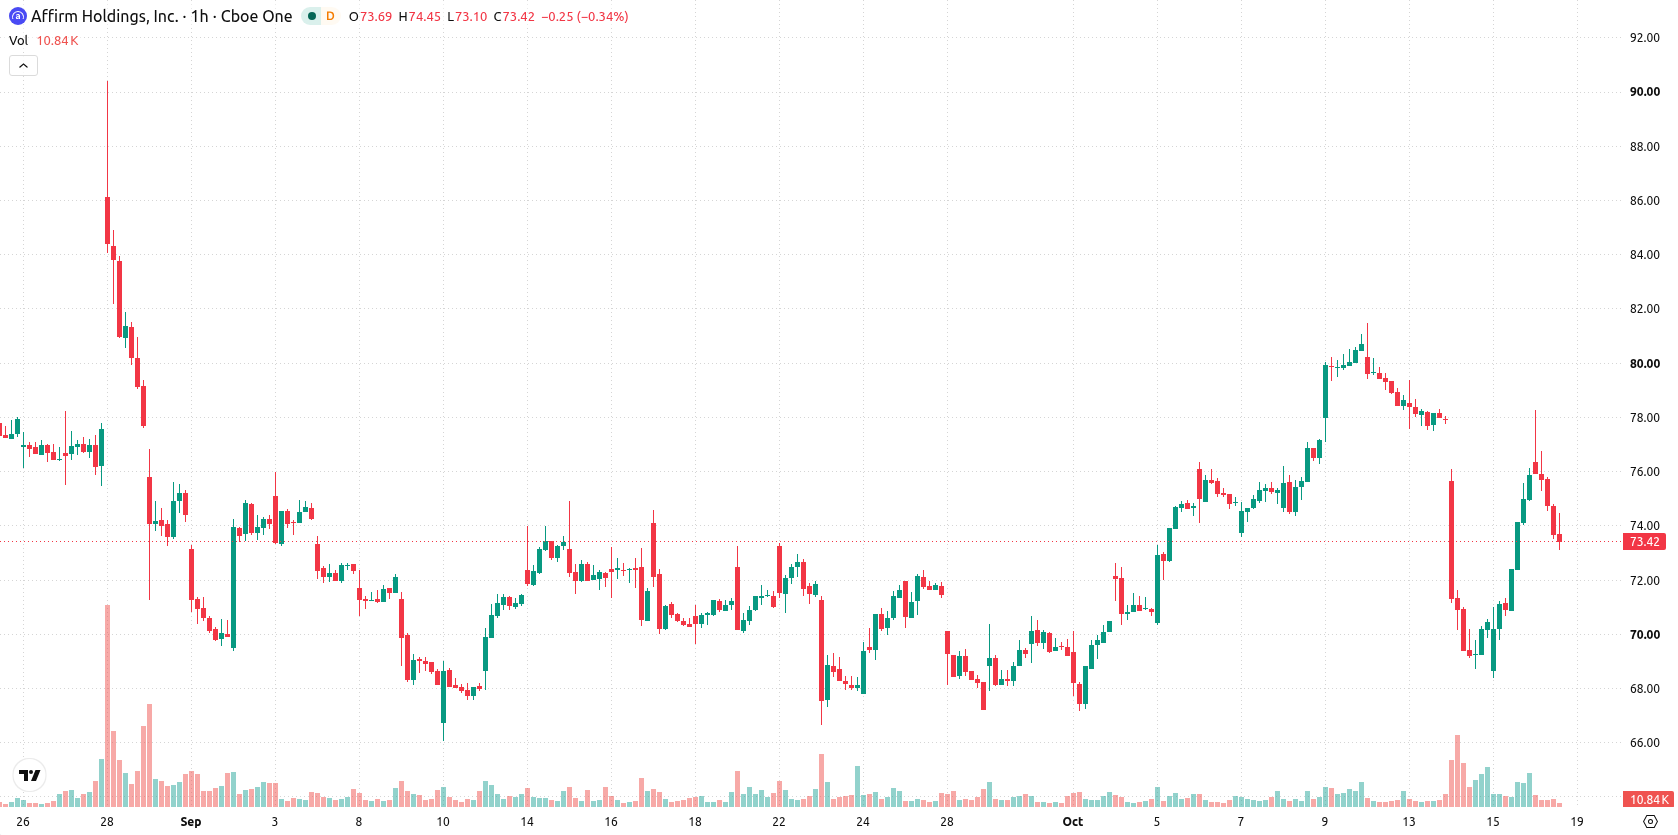
Affirm Holdings (AFRM) stock is trading at $73.38, down 3.35% from the previous close and finishing near the session’s low. The price remains above its key short-term moving average but below several medium-term averages.
 78.22
81.26
Highlights
- Shares of Affirm Holdings experienced significant volatility, with market capitalization rising $2 billion intraday as inflation data moved Treasury yields higher.
- No company-specific developments such as operational updates or product news emerged during the trading sessions that saw large market moves.
- Affirm Holdings stock trades between short-term support and medium-term resistance, with a forecasted range of $67.61 to $79.19 and mixed technical momentum signals.
Market cap swells amid macro-driven volatility
Affirm Holdings experienced notable volatility around October 15, 2026, as heightened inflation data led to rising Treasury yields, a factor that typically exerts downward pressure on growth-oriented stocks by raising their discount rates, according to Ecommerceparadise. During this period, the company's market capitalization expanded by about $2 billion in intraday trading, a move reflecting considerable market reactivity to macroeconomic developments rather than company-specific news, as noted by Gurufocus and 247wallst. No operational updates, product launches, or other confirmed actions were reported from Affirm during these sessions.
Mixed momentum and resistance as bullish signals face pressure
AFRM is trading above the MA-20 at $73.09, with the MA-50 overhead at $75.94 and firmer long-term support from the MA-200 at $66.82. The Ichimoku Kijun at $73.87 is acting as immediate resistance. Indicator signals are mixed: the RSI reads 52.32, signaling buy; MACD is neutral; ADX also signals buy, confirming some underlying momentum. Both Stoch RSI and CCI are neutral, while Bull/Bear Power shows overbought conditions and short-term buyer dominance. The Awesome Oscillator is in a strong buy posture. Overall, intraday volatility is notable, with persistent downside pressure into the close despite some bullish indicator signals.
Sideways trading likely as catalysts remain absent
Over the next 2 to 3 sessions, AFRM is likely to trade within a volatility band of $67.61 to $79.19. The probability of an upward or downward movement is balanced at 50%, so neither direction is favored. A move above the $73.87 Ichimoku Kijun could trigger a test of the upper range, while a breakdown below the lower bound would confirm renewed selling. The baseline scenario is for the stock to oscillate sideways in this defined corridor absent new catalysts.
Previously it was reported that Affirm shares were under sustained pressure amid technical resistance and negative macroeconomic influences, with downside risk cited as the dominant concern. The latest analysis introduces a more balanced short-term outlook, with mixed indicator signals and heightened volatility suggesting traders should monitor reactions around the $73.87 resistance and the established volatility band for directional cues.









-
 Afghanistan
-
 Albania
-
 Algeria
-
 Angola
-
 Argentina
-
 Armenia
-
 Australia
-
 Austria
-
 Azerbaijan
-
 Bahamas
-
 Bahrain
-
 Bangladesh
-
 Belarus
-
 Belgium
-
 Bolivia
-
 Botswana
-
 Brazil
-
 Brunei
-
 Bulgaria
-
 Cambodia
-
 Cameroon
-
 Canada
-
 Chile
-
 China
-
 Colombia
-
 Congo
-
 Costa Rica
-
 Cote d'Ivoire
-
 Croatia
-
 Cuba
-
 Cyprus
-
 Czechia
-
 DR Congo
-
 Denmark
-
 Dominican Republic
-
 Ecuador
-
 Egypt
-
 El Salvador
-
 Estonia
-
 Eswatini
-
 Ethiopia
-
 Finland
-
 France
-
 Georgia
-
 Germany
-
 Ghana
-
 Greece
-
 Haiti
-
 Hong Kong
-
 Hungary
-
 India
-
 Indonesia
-
 Iran, Islamic republic
-
 Iraq
-
 Ireland
-
 Israel
-
 Italy
-
 Jamaica
-
 Japan
-
 Jordan
-
 Kazakhstan
-
 Kenya
-
 Korea
-
 Kuwait
-
 Kyrgyzstan
-
 Laos
-
 Latvia
-
 Lebanon
-
 Lesotho
-
 Libya
-
 Lithuania
-
 Luxembourg
-
 Madagascar
-
 Malaysia
-
 Malta
-
 Mauritius
-
 Mexico
-
 Moldova
-
 Mongolia
-
 Montenegro
-
 Morocco
-
 Mozambique
-
 Myanmar
-
 Namibia
-
 Nepal
-
 Netherlands
-
 New Zealand
-
 Nigeria
-
 North Macedonia
-
 Norway
-
 Oman
-
 Pakistan
-
 Palestine
-
 Panama
-
 Papua New Guinea
-
 Paraguay
-
 Peru
-
 Philippines
-
 Poland
-
 Portugal
-
 Puerto Rico
-
 Qatar
-
 Reunion
-
 Romania
-
 Rwanda
-
 Saudi Arabia
-
 Serbia
-
 Singapore
-
 Slovakia
-
 Slovenia
-
 Somalia
-
 South Africa
-
 Spain
-
 Sri Lanka
-
 Sweden
-
 Switzerland
-
 Syria
-
 Taiwan
-
 Tajikistan
-
 Tanzania
-
 Thailand
-
 Trinidad and Tobago
-
 Tunisia
-
 Turkey
-
 UAE
-
 Uganda
-
 Ukraine
-
 United Kingdom
-
United States
-
 Uruguay
-
 Uzbekistan
-
 Venezuela
-
 Vietnam
-
 Yemen
-
 Zambia
-
 Zimbabwe
- Forex
- Crypto












