

AFRM declines as weak momentum and selling pressure control short-term trend

Affirm Holdings (AFRM) stock is trading at $65.76, down 3.34% on the day. The price currently sits below its main moving averages and is fluctuating mid-range for the session amid high volatility.
 68.13
77.47
Highlights
- Affirm Holdings reported EPS of $0.47 and revenue of $1.15 billion, both exceeding expectations.
- Shares of Affirm stock remain under broad selling pressure despite the earnings outperformance.
- Technical indicators register strong sell momentum, with the stock trading below key moving averages and the next expected range at $60.91 to $70.61.
Operating outperformance tempers negative sentiment amid persistent selling
Affirm Holdings reported quarterly earnings that exceeded expectations, with EPS reaching $0.47 compared to the consensus estimate of $0.38, and revenue totaling $1.15 billion according to MarketBeat. This outperformance demonstrates fundamental operating strength, potentially limiting the scope of negative sentiment following the release. Despite these results, the stock remains under broad selling pressure.
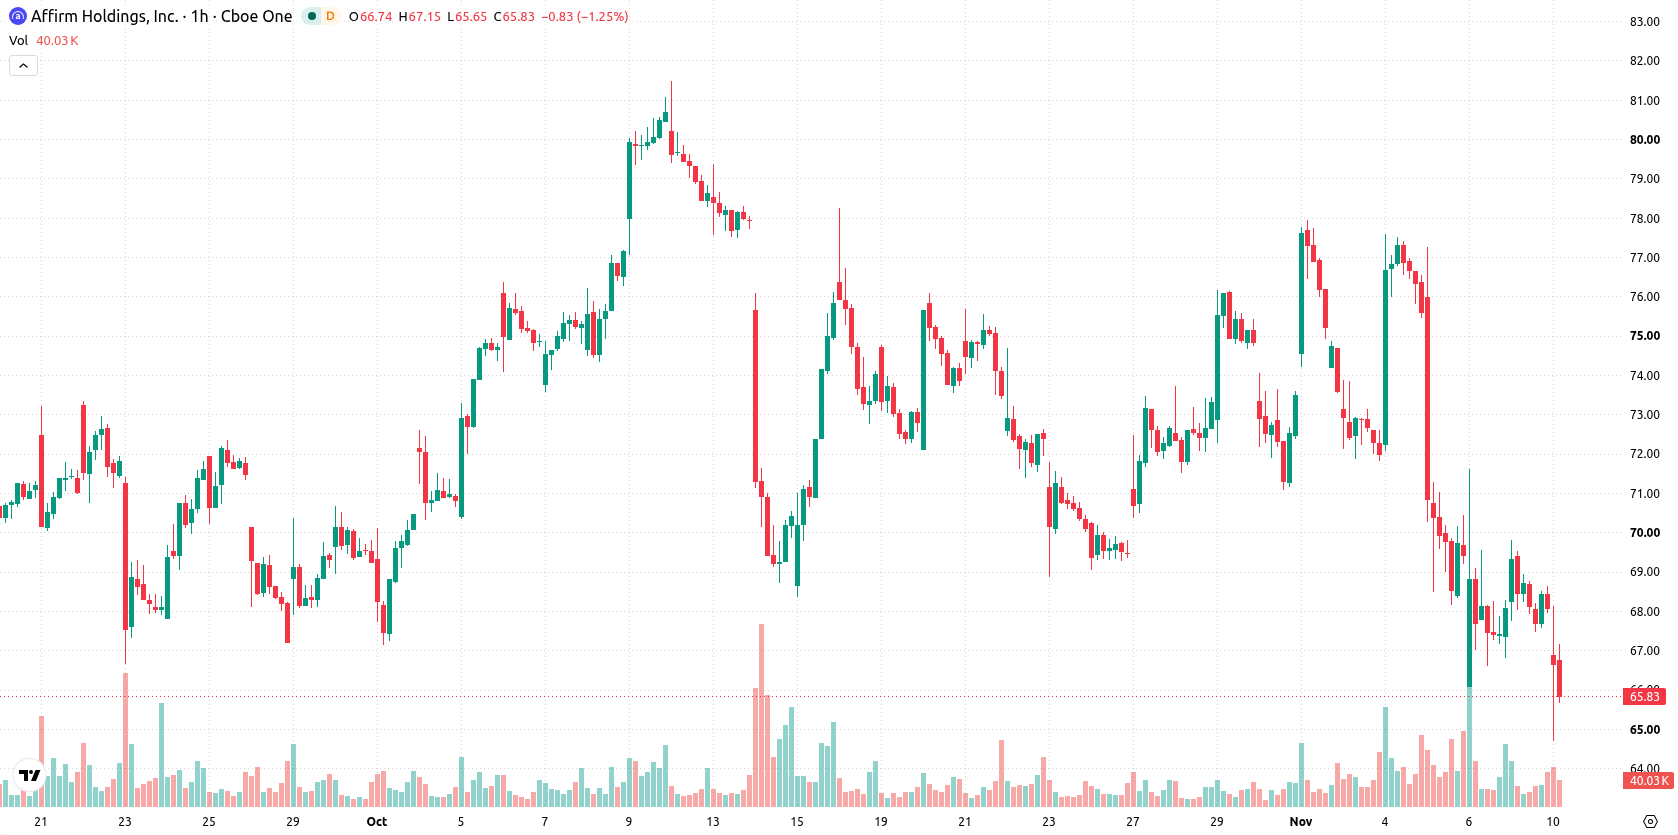
Bearish momentum as price holds below resistance and signals diverge
On the hourly chart, AFRM remains below specific technical levels, including the MA-20 at $68.59, the MA-50 at $72.02, and the long-term MA-200 at $66.49. The Ichimoku Kijun sits at $71.81, marking immediate resistance. MACD signals strong sell momentum, and ADX reinforces that sellers are in control. Readings for RSI, Stochastic RSI, and CCI are neutral, with no oscillators in an extreme zone. Bull/Bear Power is marginally negative at -0.04, indicating slight intraday seller dominance. The Awesome Oscillator offers no directional bias, confirming a lack of bullish crossover or divergence.
Downside risk dominates as tight range signals volatile outlook
Over the next several trading days, AFRM's price is expected to remain volatile within a $60.91 to $70.61 range. The probability of a further decline is substantially higher than any rebound in the short term. If price holds within these boundaries, sideways movement is likely. A move above immediate resistance would trigger a bullish scenario, while a break below the lower boundary could prompt renewed downside risk.
Previously it was reported that Affirm faced sustained selling pressure despite solid earnings and a raised guidance outlook. The current analysis reinforces this cautious stance, highlighting ongoing technical weakness and signaling that traders should monitor the $66.49 long-term moving average as a critical level for potential directional shifts.










-
 Afghanistan
-
 Albania
-
 Algeria
-
 Angola
-
 Argentina
-
 Armenia
-
 Australia
-
 Austria
-
 Azerbaijan
-
 Bahamas
-
 Bahrain
-
 Bangladesh
-
 Belarus
-
 Belgium
-
 Bolivia
-
 Botswana
-
 Brazil
-
 Brunei
-
 Bulgaria
-
 Cambodia
-
 Cameroon
-
 Canada
-
 Chile
-
 China
-
 Colombia
-
 Congo
-
 Costa Rica
-
 Cote d'Ivoire
-
 Croatia
-
 Cuba
-
 Cyprus
-
 Czechia
-
 DR Congo
-
 Denmark
-
 Dominican Republic
-
 Ecuador
-
 Egypt
-
 El Salvador
-
 Estonia
-
 Eswatini
-
 Ethiopia
-
 Finland
-
 France
-
 Georgia
-
 Germany
-
 Ghana
-
 Greece
-
 Haiti
-
 Hong Kong
-
 Hungary
-
 India
-
 Indonesia
-
 Iran, Islamic republic
-
 Iraq
-
 Ireland
-
 Israel
-
 Italy
-
 Jamaica
-
 Japan
-
 Jordan
-
 Kazakhstan
-
 Kenya
-
 Korea
-
 Kuwait
-
 Kyrgyzstan
-
 Laos
-
 Latvia
-
 Lebanon
-
 Lesotho
-
 Libya
-
 Lithuania
-
 Luxembourg
-
 Madagascar
-
 Malaysia
-
 Malta
-
 Mauritius
-
 Mexico
-
 Moldova
-
 Mongolia
-
 Montenegro
-
 Morocco
-
 Mozambique
-
 Myanmar
-
 Namibia
-
 Nepal
-
 Netherlands
-
 New Zealand
-
 Nigeria
-
 North Macedonia
-
 Norway
-
 Oman
-
 Pakistan
-
 Palestine
-
 Panama
-
 Papua New Guinea
-
 Paraguay
-
 Peru
-
 Philippines
-
 Poland
-
 Portugal
-
 Puerto Rico
-
 Qatar
-
 Reunion
-
 Romania
-
 Rwanda
-
 Saudi Arabia
-
 Serbia
-
 Singapore
-
 Slovakia
-
 Slovenia
-
 Somalia
-
 South Africa
-
 Spain
-
 Sri Lanka
-
 Sweden
-
 Switzerland
-
 Syria
-
 Taiwan
-
 Tajikistan
-
 Tanzania
-
 Thailand
-
 Trinidad and Tobago
-
 Tunisia
-
 Turkey
-
 UAE
-
 Uganda
-
 Ukraine
-
 United Kingdom
-
United States
-
 Uruguay
-
 Uzbekistan
-
 Venezuela
-
 Vietnam
-
 Yemen
-
 Zambia
-
 Zimbabwe
- Forex
- Crypto












