

Affirm shares technical analysis: Selling momentum builds as price hovers over $66.53 support

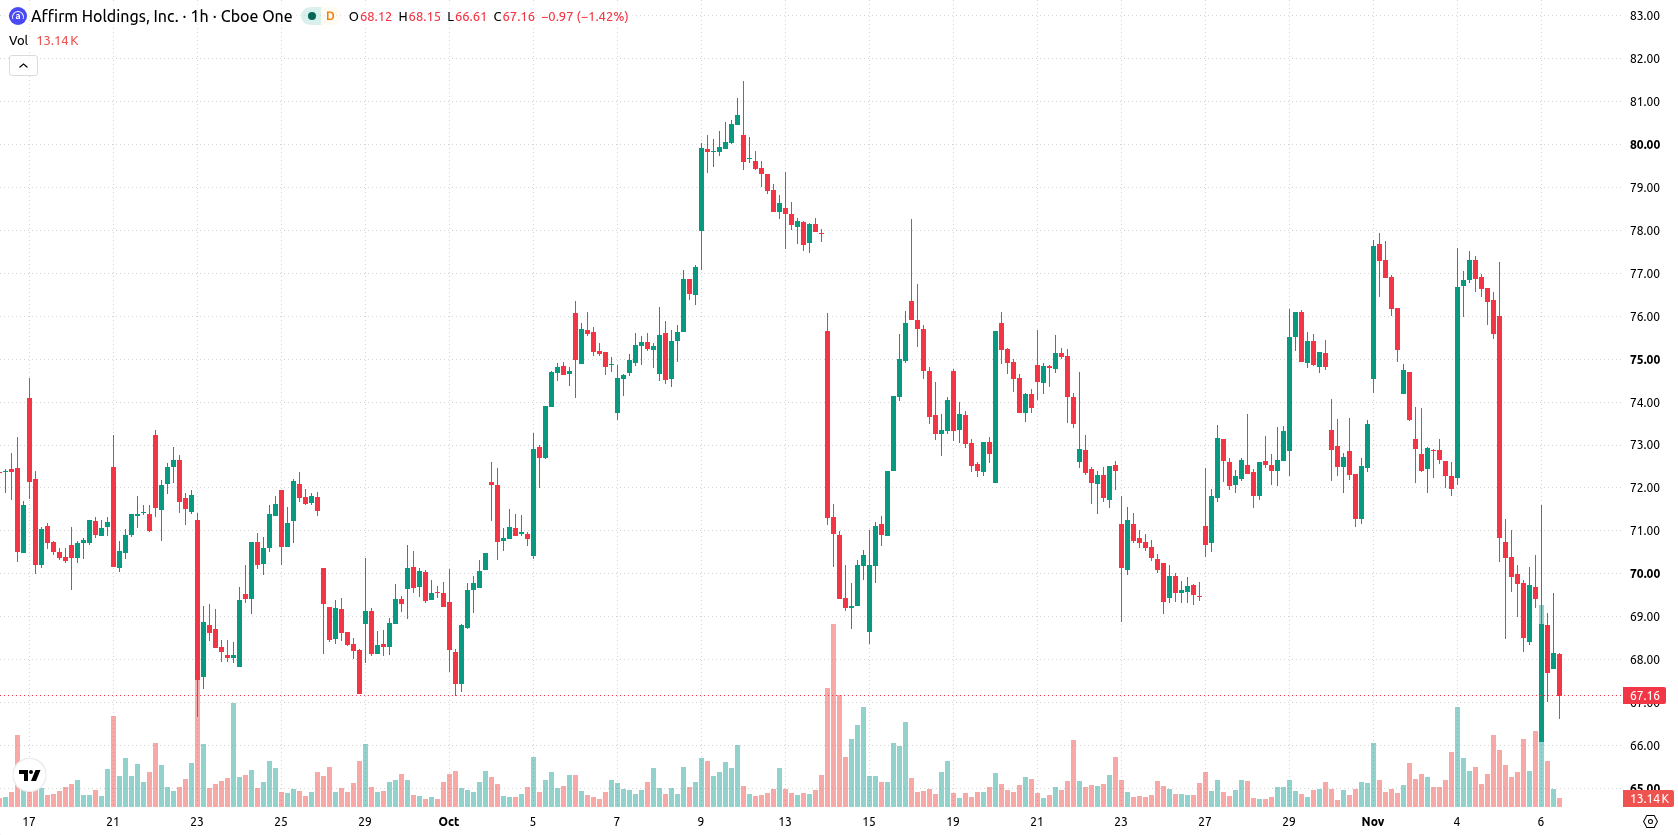
Affirm (AFRM) stock is trading at $66.88, marking a daily decline of 3.99%. The price sits below its short- and medium-term moving averages, while holding a slight premium versus its longer-term trend levels.
 71.50
77.90
Highlights
- Affirm Holdings reported fiscal Q1 2027 revenue of $1.26 billion and GAAP earnings per share of $0.47, both above analyst estimates.
- Gross merchandise volume expanded 34% year over year to $14.4 billion, and the company raised full-year 2027 guidance to over $65.25 billion.
- Shares of Affirm closed at $66.88, down 3.99% for the day, with technical signals showing short- and medium-term bearish momentum and an expected range of $62.52 to $71.24.
Outperformance in earnings offset by persistent selling pressure
Affirm Holdings reported fiscal first-quarter 2027 results for the period ended September 30, 2026, with revenue reaching $1.26 billion and GAAP earnings per share of $0.47, both exceeding analyst estimates, according to Investing.com. The quarterly results reflected strong operational momentum, as gross merchandise volume expanded 34% year-over-year to $14.4 billion, driven by growth in direct-to-consumer products, increased card activity, and higher participation from merchants and consumers, as highlighted by TradingView. Additionally, Affirm raised its full-year 2027 GMV guidance to over $65.25 billion after the robust fundamental performance, though price action has remained under broader selling pressure.
Support holds amid oversold signals as momentum remains weak
On the technical side, AFRM/USD remains below its MA-20 ($72.61) and MA-50 ($73.44), while holding slightly above its MA-200 ($66.53) on the daily chart. The Ichimoku Kijun at $71.82 now serves as immediate resistance. Both MACD and ADX reflect ongoing selling momentum, while RSI is neutral and Stoch RSI plus CCI indicate oversold conditions. Bull/Bear Power is negative at -1.77, and the Awesome Oscillator is positioned to the downside.
Downside bias persists pending breakout from consolidation range
Over the short term, AFRM is expected to move within a $62.52 to $71.24 range, with downward momentum remaining more probable than any significant recovery. A base scenario suggests near-term consolidation within this band. Only a breakout above immediate resistance could open room for a bullish move, while a close below support would likely accelerate declines toward the lower end of the projected volatility band.
Previously it was reported that Affirm faced pronounced selling pressure and heightened downside risk after a sharp valuation drop, with technical indicators pointing toward further weakness. The latest earnings beat and raised guidance add a fundamental tailwind, but with price action still under pressure and key resistance overhead, traders should watch the $66.53 daily MA-200 as a critical level for directional confirmation in the days ahead.






Latest Affirm News




-
 Afghanistan
-
 Albania
-
 Algeria
-
 Angola
-
 Argentina
-
 Armenia
-
 Australia
-
 Austria
-
 Azerbaijan
-
 Bahamas
-
 Bahrain
-
 Bangladesh
-
 Belarus
-
 Belgium
-
 Bolivia
-
 Botswana
-
 Brazil
-
 Brunei
-
 Bulgaria
-
 Cambodia
-
 Cameroon
-
 Canada
-
 Chile
-
 China
-
 Colombia
-
 Congo
-
 Costa Rica
-
 Cote d'Ivoire
-
 Croatia
-
 Cuba
-
 Cyprus
-
 Czechia
-
 DR Congo
-
 Denmark
-
 Dominican Republic
-
 Ecuador
-
 Egypt
-
 El Salvador
-
 Estonia
-
 Eswatini
-
 Ethiopia
-
 Finland
-
 France
-
 Georgia
-
 Germany
-
 Ghana
-
 Greece
-
 Haiti
-
 Hong Kong
-
 Hungary
-
 India
-
 Indonesia
-
 Iran, Islamic republic
-
 Iraq
-
 Ireland
-
 Israel
-
 Italy
-
 Jamaica
-
 Japan
-
 Jordan
-
 Kazakhstan
-
 Kenya
-
 Korea
-
 Kuwait
-
 Kyrgyzstan
-
 Laos
-
 Latvia
-
 Lebanon
-
 Lesotho
-
 Libya
-
 Lithuania
-
 Luxembourg
-
 Madagascar
-
 Malaysia
-
 Malta
-
 Mauritius
-
 Mexico
-
 Moldova
-
 Mongolia
-
 Montenegro
-
 Morocco
-
 Mozambique
-
 Myanmar
-
 Namibia
-
 Nepal
-
 Netherlands
-
 New Zealand
-
 Nigeria
-
 North Macedonia
-
 Norway
-
 Oman
-
 Pakistan
-
 Palestine
-
 Panama
-
 Papua New Guinea
-
 Paraguay
-
 Peru
-
 Philippines
-
 Poland
-
 Portugal
-
 Puerto Rico
-
 Qatar
-
 Reunion
-
 Romania
-
 Rwanda
-
 Saudi Arabia
-
 Serbia
-
 Singapore
-
 Slovakia
-
 Slovenia
-
 Somalia
-
 South Africa
-
 Spain
-
 Sri Lanka
-
 Sweden
-
 Switzerland
-
 Syria
-
 Taiwan
-
 Tajikistan
-
 Tanzania
-
 Thailand
-
 Trinidad and Tobago
-
 Tunisia
-
 Turkey
-
 UAE
-
 Uganda
-
 Ukraine
-
 United Kingdom
-
United States
-
 Uruguay
-
 Uzbekistan
-
 Venezuela
-
 Vietnam
-
 Yemen
-
 Zambia
-
 Zimbabwe
- Forex
- Crypto












