

Will Affirm stock break $79.23 resistance as upward price move continues?

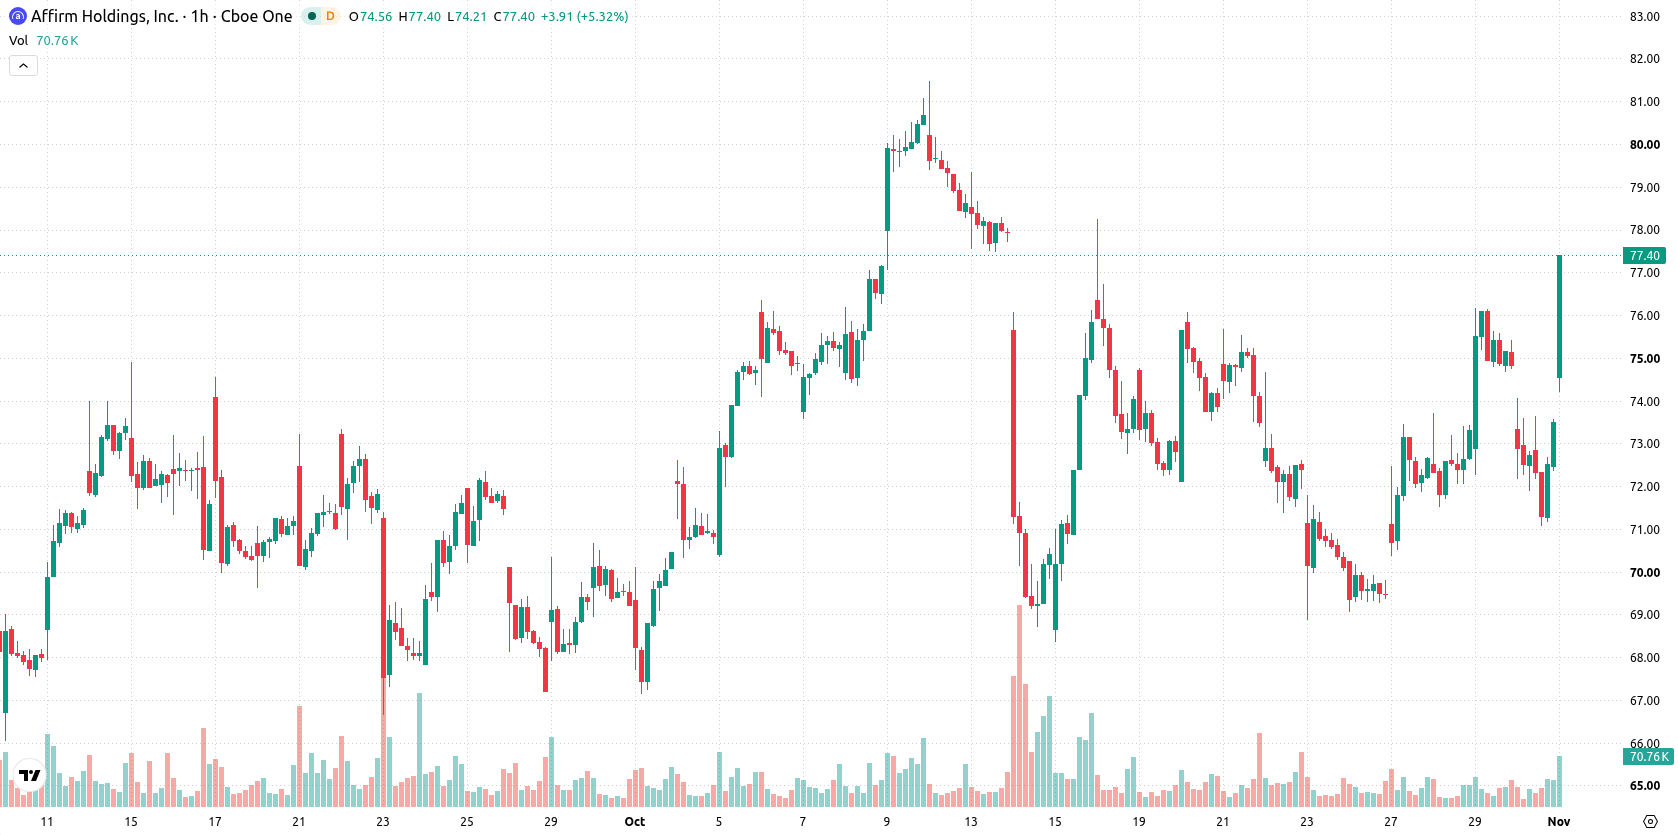
Affirm Holdings, Inc. (AFRM) stock is trading at $76.69, showing a daily gain of 4.35%. The stock currently sits above its key moving averages, reflecting broad underlying strength.
 71.78
77.90
Highlights
- AFRM stock is in a bullish technical structure, trading above its short- and long-term moving averages.
- Support is identified near $73.62, with intraday price action showing strong upside on high volatility.
- The forecast range for the next sessions is $71.95 to $79.23, with a high probability of upward movement.
Mixed momentum as bullish structure faces persistent intraday selling
MA-20 and MA-50 are both below the current price, while MA-200 is also positioned lower, confirming a robust bullish structure. The Ichimoku Kijun level at $73.62 serves as immediate support. Momentum readings are mixed: RSI signals Buy and ADX suggests buying interest, but both MACD and most other oscillators are Neutral. Stochastic RSI and CCI readings are also Neutral, while Bull/Bear Power points to oversold conditions, suggesting sellers maintain some influence intraday despite recent strength.
Rangebound outlook as breakout and downside risks remain elevated
In the near term, AFRM is expected to trade within the $71.95 to $79.23 range, reflecting typical volatility around current levels. The probability of an upward move remains high, with a potential breakout above resistance possibly triggering accelerated gains. Conversely, a break below immediate support could bring a push toward the lower boundary of the forecast range.
Earlier, analysts noted that Affirm was exhibiting a cautious technical setup with conflicting momentum signals, suggesting traders monitor key support levels for direction. With the stock now trading firmly above its major moving averages and mixed short-term indicators, traders should closely watch for a potential breakout above the current resistance range, which could shift the prevailing scenario in favor of further upside.










-
 Afghanistan
-
 Albania
-
 Algeria
-
 Angola
-
 Argentina
-
 Armenia
-
 Australia
-
 Austria
-
 Azerbaijan
-
 Bahamas
-
 Bahrain
-
 Bangladesh
-
 Belarus
-
 Belgium
-
 Bolivia
-
 Botswana
-
 Brazil
-
 Brunei
-
 Bulgaria
-
 Cambodia
-
 Cameroon
-
 Canada
-
 Chile
-
 China
-
 Colombia
-
 Congo
-
 Costa Rica
-
 Cote d'Ivoire
-
 Croatia
-
 Cuba
-
 Cyprus
-
 Czechia
-
 DR Congo
-
 Denmark
-
 Dominican Republic
-
 Ecuador
-
 Egypt
-
 El Salvador
-
 Estonia
-
 Eswatini
-
 Ethiopia
-
 Finland
-
 France
-
 Georgia
-
 Germany
-
 Ghana
-
 Greece
-
 Haiti
-
 Hong Kong
-
 Hungary
-
 India
-
 Indonesia
-
 Iran, Islamic republic
-
 Iraq
-
 Ireland
-
 Israel
-
 Italy
-
 Jamaica
-
 Japan
-
 Jordan
-
 Kazakhstan
-
 Kenya
-
 Korea
-
 Kuwait
-
 Kyrgyzstan
-
 Laos
-
 Latvia
-
 Lebanon
-
 Lesotho
-
 Libya
-
 Lithuania
-
 Luxembourg
-
 Madagascar
-
 Malaysia
-
 Malta
-
 Mauritius
-
 Mexico
-
 Moldova
-
 Mongolia
-
 Montenegro
-
 Morocco
-
 Mozambique
-
 Myanmar
-
 Namibia
-
 Nepal
-
 Netherlands
-
 New Zealand
-
 Nigeria
-
 North Macedonia
-
 Norway
-
 Oman
-
 Pakistan
-
 Palestine
-
 Panama
-
 Papua New Guinea
-
 Paraguay
-
 Peru
-
 Philippines
-
 Poland
-
 Portugal
-
 Puerto Rico
-
 Qatar
-
 Reunion
-
 Romania
-
 Rwanda
-
 Saudi Arabia
-
 Serbia
-
 Singapore
-
 Slovakia
-
 Slovenia
-
 Somalia
-
 South Africa
-
 Spain
-
 Sri Lanka
-
 Sweden
-
 Switzerland
-
 Syria
-
 Taiwan
-
 Tajikistan
-
 Tanzania
-
 Thailand
-
 Trinidad and Tobago
-
 Tunisia
-
 Turkey
-
 UAE
-
 Uganda
-
 Ukraine
-
 United Kingdom
-
United States
-
 Uruguay
-
 Uzbekistan
-
 Venezuela
-
 Vietnam
-
 Yemen
-
 Zambia
-
 Zimbabwe
- Forex
- Crypto












