

Can new defense contracts fuel further upside for RTX stock?

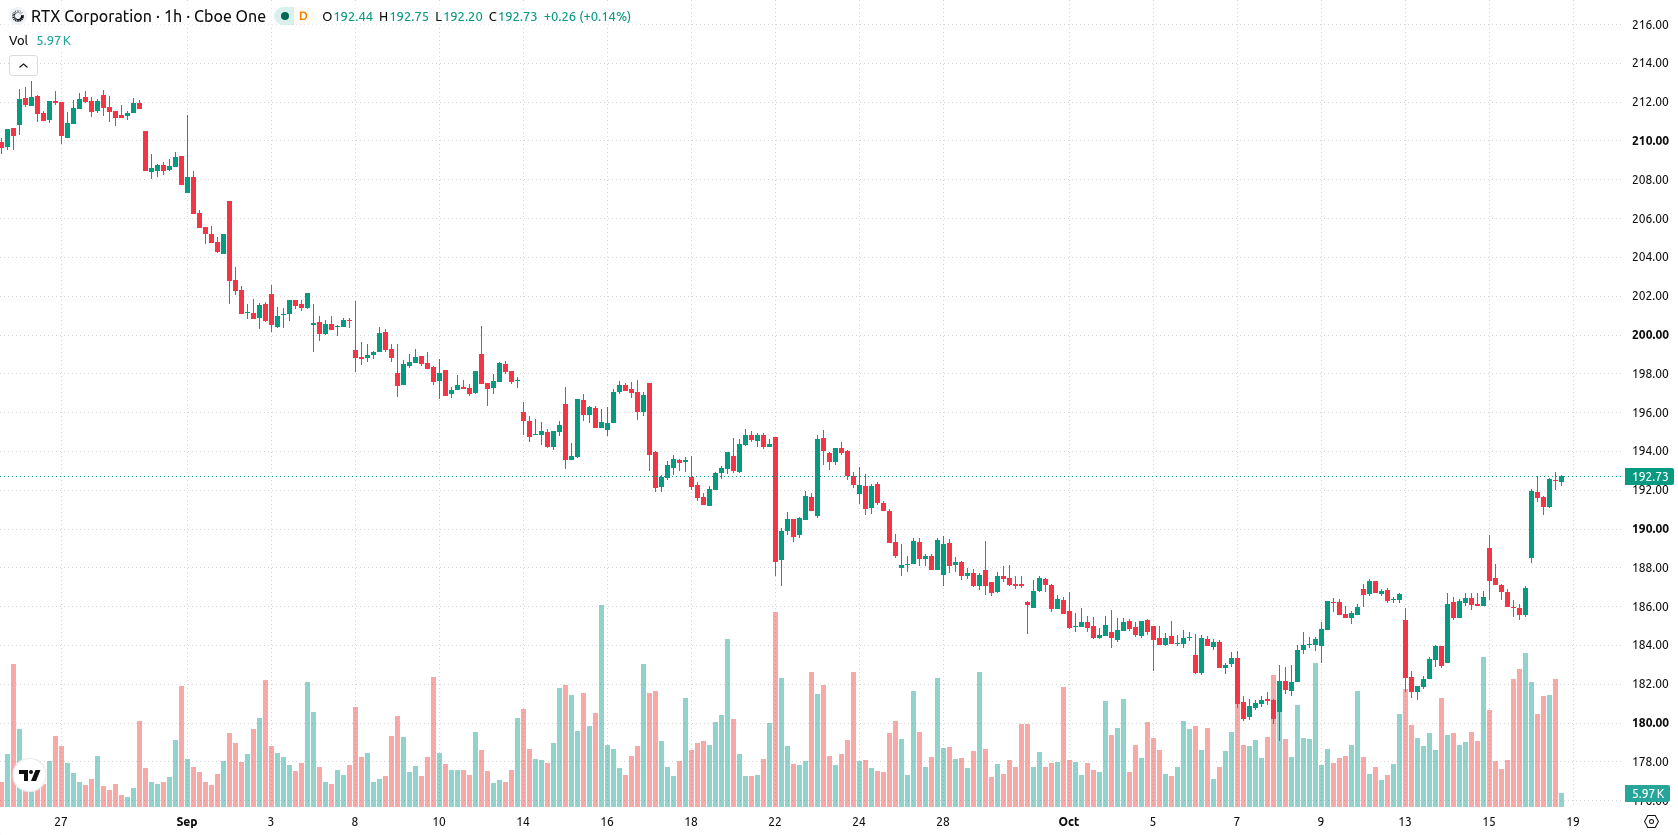
RTX (RTX) stock is trading at $193.22, up 3.38% on the session. The price currently sits above its key moving averages in the short to medium term, reflecting recent positive momentum.
 194.28
194.28
194.28
Highlights
- RTX secured a contract worth up to $6.3 billion to supply and maintain SM-3 Block IB interceptors over five years.
- The agreement offers substantial revenue visibility and signals ongoing strong government demand for RTX defense technologies.
- RTX stock closed at $193.22, up 3.38%, with technical signals showing overbought conditions and a likely $189.71 to $196.73 price range.
Long-term growth prospects improve as billion-dollar missile deal secures demand
Raytheon's recent award of a contract worth up to $6.3 billion to produce and maintain Standard Missile-3 Block IB interceptors over the next five years has become a key driver for RTX, according to Simplywall. The magnitude and duration of this agreement provide significant revenue certainty and demonstrate sustained government demand for RTX's defense technologies. Such a high-profile order bolsters long-term expectations for the company's growth trajectory and encourages renewed investor interest.
Overbought signals intensify as technical momentum outpaces resistance
On the technical side, RTX trades above the MA-20 at $187.58 and the MA-50 at $185.56, with resistance set by the MA-200 near $194.99. Immediate support is established at the Ichimoku Kijun level of $187.05. Momentum metrics are robust, as MACD and ADX maintain buy signals, while RSI stands at 72.26. Additional indicators including Stoch RSI, CCI, and Bull/Bear Power are all in overbought territory. The Awesome Oscillator also supports the prevailing trend, but persistent overbought readings highlight the likelihood of interim pullbacks.
Range-bound movement likely as volatility contains near-term risks
In the short term, RTX is expected to fluctuate within a range of $189.71 to $196.73, consistent with its typical volatility band. The baseline scenario projects sideways trading between these boundaries. Should bullish momentum persist and resistance be breached, upside targets align with the upper boundary of the corridor. Conversely, a drop below support at $187.05 would increase the odds of a corrective move within the forecast range.
Earlier, analysts noted that RTX was under sustained technical selling pressure and maintaining a bearish structure. The latest technical reversal and momentum shift now put the focus on whether RTX can sustain a breakout above $194.99 or faces a short-term pullback from overbought conditions.




Latest RTX News




-
 Afghanistan
-
 Albania
-
 Algeria
-
 Angola
-
 Argentina
-
 Armenia
-
 Australia
-
 Austria
-
 Azerbaijan
-
 Bahamas
-
 Bahrain
-
 Bangladesh
-
 Belarus
-
 Belgium
-
 Bolivia
-
 Botswana
-
 Brazil
-
 Brunei
-
 Bulgaria
-
 Cambodia
-
 Cameroon
-
 Canada
-
 Chile
Chile
-
 China
China
-
 Colombia
-
 Congo
Congo
-
 Costa Rica
-
 Cote d'Ivoire
-
 Croatia
-
 Cuba
Cuba
-
 Cyprus
-
 Czechia
-
 DR Congo
-
 Denmark
-
 Dominican Republic
-
 Ecuador
-
 Egypt
Egypt
-
 El Salvador
-
 Estonia
-
 Eswatini
-
 Ethiopia
-
 Finland
-
 France
-
 Georgia
-
 Germany
-
 Ghana
Ghana
-
 Greece
-
 Haiti
Haiti
-
 Hong Kong
-
 Hungary
-
 India
India
-
 Indonesia
-
 Iran, Islamic republic
-
 Iraq
Iraq
-
 Ireland
-
 Israel
-
 Italy
Italy
-
 Jamaica
-
 Japan
Japan
-
 Jordan
-
 Kazakhstan
-
 Kenya
Kenya
-
 Korea
Korea
-
 Kuwait
-
 Kyrgyzstan
-
 Laos
Laos
-
 Latvia
-
 Lebanon
-
 Lesotho
-
 Libya
Libya
-
 Lithuania
-
 Luxembourg
-
 Madagascar
-
 Malaysia
-
 Malta
Malta
-
 Mauritius
-
 Mexico
-
 Moldova
-
 Mongolia
-
 Montenegro
-
 Morocco
-
 Mozambique
-
 Myanmar
-
 Namibia
-
 Nepal
Nepal
-
 Netherlands
-
 New Zealand
-
 Nigeria
-
 North Macedonia
-
 Norway
-
 Oman
Oman
-
 Pakistan
-
 Palestine
-
 Panama
-
 Papua New Guinea
-
 Paraguay
-
 Peru
Peru
-
 Philippines
-
 Poland
-
 Portugal
-
 Puerto Rico
-
 Qatar
Qatar
-
 Reunion
-
 Romania
-
 Rwanda
-
 Saudi Arabia
-
 Serbia
-
 Singapore
-
 Slovakia
-
 Slovenia
-
 Somalia
-
 South Africa
-
 Spain
Spain
-
 Sri Lanka
-
 Sweden
-
 Switzerland
-
 Syria
Syria
-
 Taiwan
-
 Tajikistan
-
 Tanzania
-
 Thailand
-
 Trinidad and Tobago
-
 Tunisia
-
 Turkey
-
 UAE
UAE
-
 Uganda
-
 Ukraine
-
 United Kingdom
-
United States
-
 Uruguay
-
 Uzbekistan
-
 Venezuela
-
 Vietnam
-
 Yemen
Yemen
-
 Zambia
-
 Zimbabwe
- Forex
- Crypto












