


Technical momentum is driving APA Corporation (APA) sharply higher, with today's 3.57% gain fueled by sustained buying pressure and a bullish trend confirmed across multiple indicators. The move is strongly supported by price action well above key moving averages and robust upward signals from both momentum and oscillator readings.
 49.26
49.26
49.26
49.26
Highlights
- APA stock trades in a strong uptrend, sitting well above short-, medium-, and long-term moving averages.
- Momentum and oscillator indicators show robust upward pressure, although some overbought signals suggest short-term overheating risk.
- APA stock is projected to consolidate between $47.53 and $49.95 with a 75% probability of an upward move.
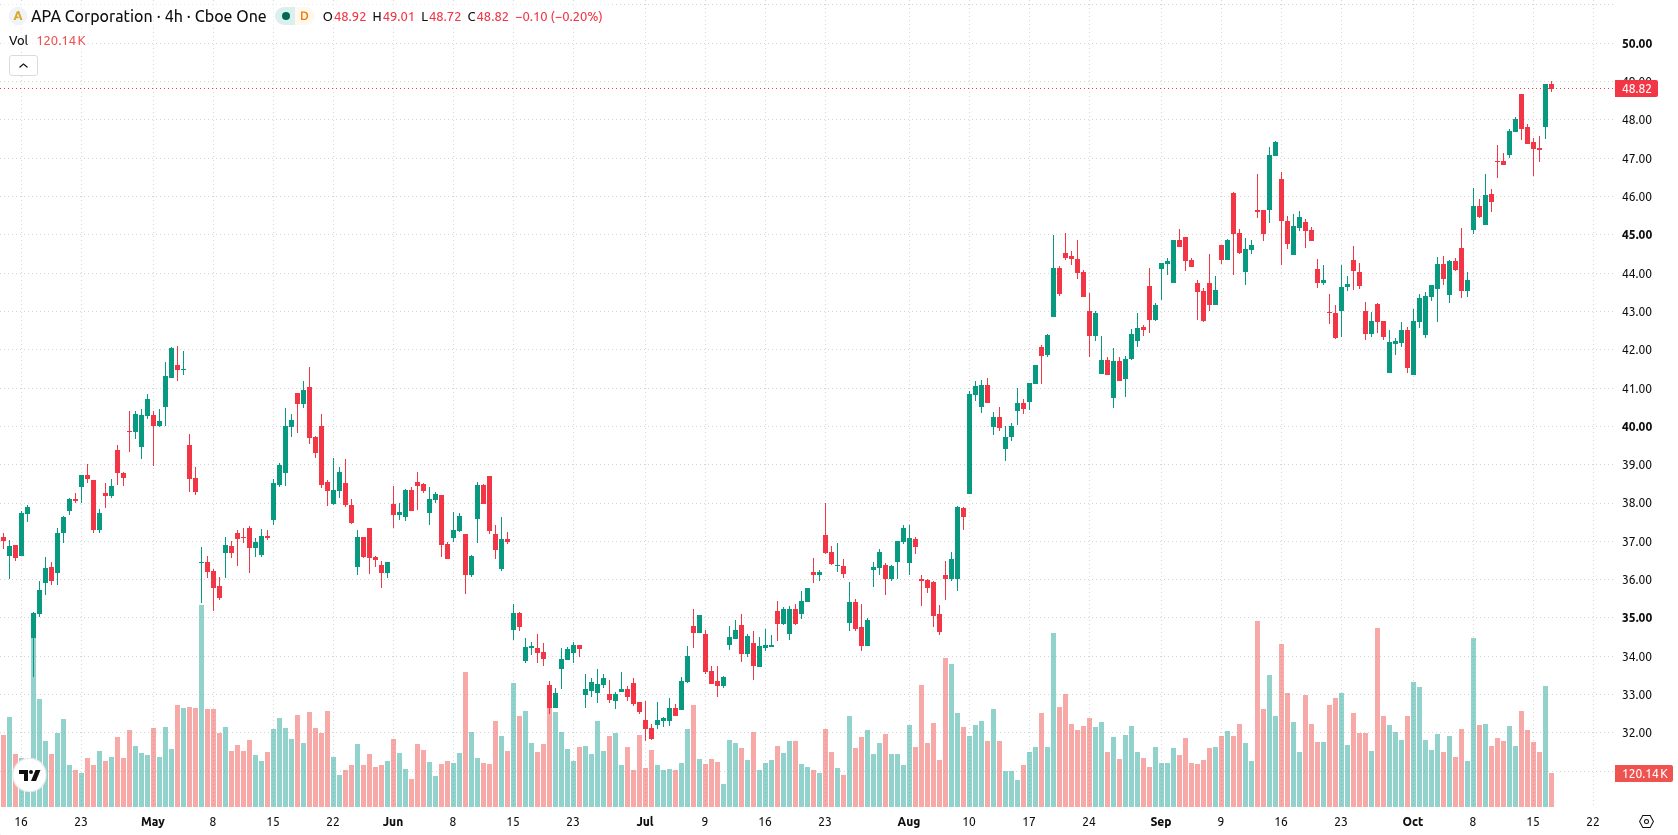
Overbought signals emerge as APA tests resistance near session highs
APA is trading well above its 20-day ($44.33), 50-day ($43.36), and 200-day ($36.31) moving averages, underscoring strength across short-, medium-, and long-term trends. The nearest resistance sits at $49.01 and immediate support is at $48.59, both within close reach, with the bullish long-term structure reinforced by moving average alignment and Ichimoku Kijun support at $44.99. Momentum indicators signal strong upward pressure, with both the Moving Average Convergence Divergence (MACD) and Average Directional Index (ADX) forecasting buy signals. The Relative Strength Index (RSI) is elevated at 63.86, while Stochastic RSI, Commodity Channel Index (CCI), and Bull/Bear Power (BBP) all indicate overbought conditions. BBP at 1.97 shows buyers currently dominate intraday momentum. The Awesome Oscillator (AO) is firmly in buy territory, supporting the current uptrend. APA opened with an upside gap of $0.64 (1.36%), and trades near the session high at $48.89 after gaining $1.69 or 3.57% today. Intraday volatility stands at 3.16%, and price action demonstrates sustained strength toward highs. Momentum and oscillator signals are largely aligned in suggesting robust upward tone, though some readings warn of short-term overheating.
Earlier, analysts noted that APA was consolidating in a sideways pattern, with traders watching for signals that could define its next meaningful move. The latest breakout-backed momentum reinforces the emerging bullish structure, making the price reaction around the $49.01 resistance a pivotal level to watch for either continuation or reversal.





Latest APA Corporation News





-
 Afghanistan
-
 Albania
-
 Algeria
-
 Angola
-
 Argentina
-
 Armenia
-
 Australia
-
 Austria
-
 Azerbaijan
-
 Bahamas
-
 Bahrain
-
 Bangladesh
-
 Belarus
-
 Belgium
-
 Bolivia
-
 Botswana
-
 Brazil
-
 Brunei
-
 Bulgaria
-
 Cambodia
-
 Cameroon
-
 Canada
-
 Chile
Chile
-
 China
China
-
 Colombia
-
 Congo
Congo
-
 Costa Rica
-
 Cote d'Ivoire
-
 Croatia
-
 Cuba
Cuba
-
 Cyprus
-
 Czechia
-
 DR Congo
-
 Denmark
-
 Dominican Republic
-
 Ecuador
-
 Egypt
Egypt
-
 El Salvador
-
 Estonia
-
 Eswatini
-
 Ethiopia
-
 Finland
-
 France
-
 Georgia
-
 Germany
-
 Ghana
Ghana
-
 Greece
-
 Haiti
Haiti
-
 Hong Kong
-
 Hungary
-
 India
India
-
 Indonesia
-
 Iran, Islamic republic
-
 Iraq
Iraq
-
 Ireland
-
 Israel
-
 Italy
Italy
-
 Jamaica
-
 Japan
Japan
-
 Jordan
-
 Kazakhstan
-
 Kenya
Kenya
-
 Korea
Korea
-
 Kuwait
-
 Kyrgyzstan
-
 Laos
Laos
-
 Latvia
-
 Lebanon
-
 Lesotho
-
 Libya
Libya
-
 Lithuania
-
 Luxembourg
-
 Madagascar
-
 Malaysia
-
 Malta
Malta
-
 Mauritius
-
 Mexico
-
 Moldova
-
 Mongolia
-
 Montenegro
-
 Morocco
-
 Mozambique
-
 Myanmar
-
 Namibia
-
 Nepal
Nepal
-
 Netherlands
-
 New Zealand
-
 Nigeria
-
 North Macedonia
-
 Norway
-
 Oman
Oman
-
 Pakistan
-
 Palestine
-
 Panama
-
 Papua New Guinea
-
 Paraguay
-
 Peru
Peru
-
 Philippines
-
 Poland
-
 Portugal
-
 Puerto Rico
-
 Qatar
Qatar
-
 Reunion
-
 Romania
-
 Rwanda
-
 Saudi Arabia
-
 Serbia
-
 Singapore
-
 Slovakia
-
 Slovenia
-
 Somalia
-
 South Africa
-
 Spain
Spain
-
 Sri Lanka
-
 Sweden
-
 Switzerland
-
 Syria
Syria
-
 Taiwan
-
 Tajikistan
-
 Tanzania
-
 Thailand
-
 Trinidad and Tobago
-
 Tunisia
-
 Turkey
-
 UAE
UAE
-
 Uganda
-
 Ukraine
-
 United Kingdom
-
United States
-
 Uruguay
-
 Uzbekistan
-
 Venezuela
-
 Vietnam
-
 Yemen
Yemen
-
 Zambia
-
 Zimbabwe
- Forex
- Crypto












