

Why is APA stock down today? Downside momentum fading; next price targets to watch

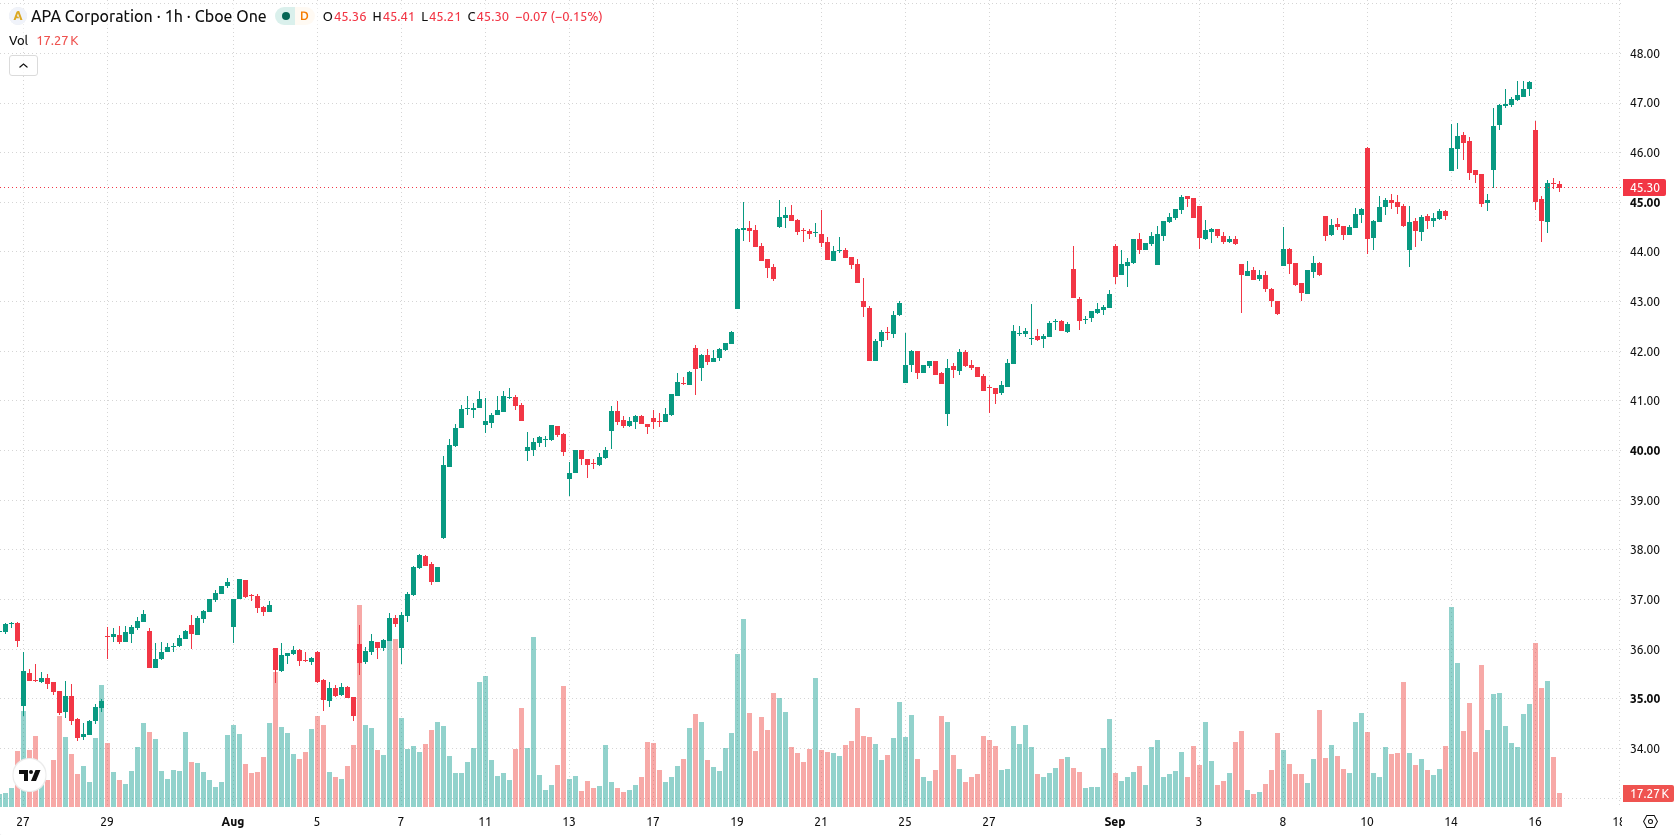
APA (APA) stock is trading at $45.27, down 4.51% on the day. The price currently sits below its key short-term averages but remains above its medium- and long-term trend levels.
 45.41
48.04
Highlights
- Shares of APA gapped down 0.97 and fell 4.51% on high volatility, trading below short-term moving averages.
- Technical indicators are mixed, with MACD showing strong buy momentum but most oscillators signaling oversold and persistent selling.
- APA stock is expected to move between $42.22 and $46.79 in coming days, with a 59% probability of an upward move.
Momentum split emerges as oversold signals counter price stability
On the hourly chart, APA is trading below the MA-20 but remains above the MA-50 and well above the long-term MA-200, which acts as support. The Ichimoku Kijun is at $45.56, presenting immediate resistance to upward moves. While MACD signals strong buy momentum, ADX points to ongoing selling pressure. Oscillators such as RSI, Stoch RSI, CCI, and Bull/Bear Power all register strong oversold and seller-dominated conditions, which, along with high volatility, underlines a bearish intraday bias. Notably, APA is holding in the middle of today’s range despite the sharp move down, underscoring a divergence between indicator readings and price action.
Sideways trading expected as reversal odds outweigh further weakness
Looking ahead to the next two to three trading days, APA is expected to fluctuate within a typical volatility band of $42.22 to $46.79. The probability of an upward move is 59%, suggesting that while further downside is possible, a short-term reversal attempt is more likely. In the base case, APA moves sideways within this range; a bullish breakout above resistance could see a push toward the upper band, while a decisive drop below support may expose weakness toward the lower limit.
In a recent review, APA was noted to have shifted from earlier bearish sentiment to a clear bullish technical trend supported by momentum indicators. The current analysis adds a new dimension, as deteriorating short-term signals and oversold oscillator readings suggest traders should monitor the $42.22–$46.79 range for potential reversals or a decisive break in either direction.






Latest APA Corporation News





-
 Afghanistan
-
 Albania
-
 Algeria
-
 Angola
-
 Argentina
-
 Armenia
-
 Australia
-
 Austria
-
 Azerbaijan
-
 Bahamas
-
 Bahrain
-
 Bangladesh
-
 Belarus
-
 Belgium
-
 Bolivia
-
 Botswana
-
 Brazil
-
 Brunei
-
 Bulgaria
-
 Cambodia
-
 Cameroon
-
 Canada
-
 Chile
-
 China
-
 Colombia
-
 Congo
-
 Costa Rica
-
 Cote d'Ivoire
-
 Croatia
-
 Cuba
-
 Cyprus
-
 Czechia
-
 DR Congo
-
 Denmark
-
 Dominican Republic
-
 Ecuador
-
 Egypt
-
 El Salvador
-
 Estonia
-
 Eswatini
-
 Ethiopia
-
 Finland
-
 France
-
 Georgia
-
 Germany
-
 Ghana
-
 Greece
-
 Haiti
-
 Hong Kong
-
 Hungary
-
 India
-
 Indonesia
-
 Iran, Islamic republic
-
 Iraq
-
 Ireland
-
 Israel
-
 Italy
-
 Jamaica
-
 Japan
-
 Jordan
-
 Kazakhstan
-
 Kenya
-
 Korea
-
 Kuwait
-
 Kyrgyzstan
-
 Laos
-
 Latvia
-
 Lebanon
-
 Lesotho
-
 Libya
-
 Lithuania
-
 Luxembourg
-
 Madagascar
-
 Malaysia
-
 Malta
-
 Mauritius
-
 Mexico
-
 Moldova
-
 Mongolia
-
 Montenegro
-
 Morocco
-
 Mozambique
-
 Myanmar
-
 Namibia
-
 Nepal
-
 Netherlands
-
 New Zealand
-
 Nigeria
-
 North Macedonia
-
 Norway
-
 Oman
-
 Pakistan
-
 Palestine
-
 Panama
-
 Papua New Guinea
-
 Paraguay
-
 Peru
-
 Philippines
-
 Poland
-
 Portugal
-
 Puerto Rico
-
 Qatar
-
 Reunion
-
 Romania
-
 Rwanda
-
 Saudi Arabia
-
 Serbia
-
 Singapore
-
 Slovakia
-
 Slovenia
-
 Somalia
-
 South Africa
-
 Spain
-
 Sri Lanka
-
 Sweden
-
 Switzerland
-
 Syria
-
 Taiwan
-
 Tajikistan
-
 Tanzania
-
 Thailand
-
 Trinidad and Tobago
-
 Tunisia
-
 Turkey
-
 UAE
-
 Uganda
-
 Ukraine
-
 United Kingdom
-
United States
-
 Uruguay
-
 Uzbekistan
-
 Venezuela
-
 Vietnam
-
 Yemen
-
 Zambia
-
 Zimbabwe
- Forex
- Crypto












