

APA climbs nearly 4% after intraday rally drives stock to session highs

APA Corporation (APA) surged 3.93% today as strong technical momentum and sustained buying pressure fueled an advance to session highs. The move is supported by consistent bullish signals, with APA trading above all major moving averages, even as several oscillators caution that overbought conditions may limit near-term upside.
 52.94
52.94
Highlights
- APA stock advanced 3.93% to close near session highs, showing strong bullish momentum across short- and long-term timeframes.
- Oscillators including the RSI and CCI show overbought conditions while MACD and ADX confirm strong upward trend signals.
- APA is projected to trade between $43.85 and $48.05 in the next five days, with over 80% probability of further gains unless it falls below $43.85.
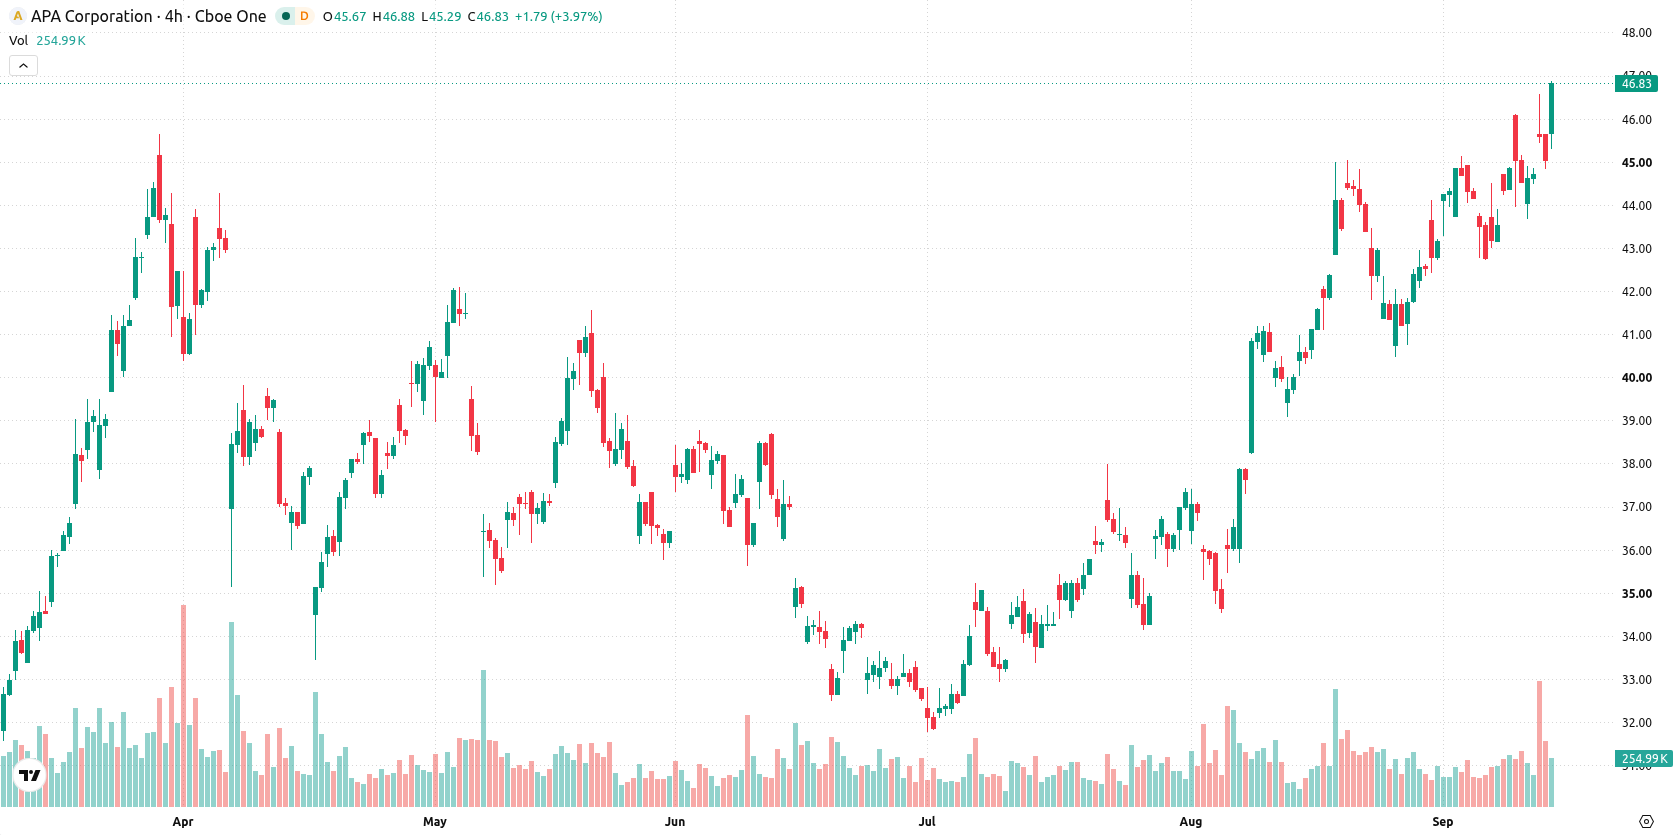
Momentum signals flagged as overbought amid persistent bullish structure
APA is trading above its 20-day ($43.37), 50-day ($39.03), and 200-day ($34.08) moving averages, confirming strong short-, medium-, and long-term bullish momentum. The prevailing trend structure remains constructive, with support and resistance defined by the near-term floor at $46.56 and the near-term ceiling at $46.89. Momentum is supported by a bullish Moving Average Convergence Divergence (MACD) and a strengthening Average Directional Index (ADX). The Relative Strength Index (RSI) and Commodity Channel Index (CCI) both hint at overbought conditions, while the Stochastic RSI is neutral, suggesting some pause in upside momentum. Bull/Bear Power (BBP) indicates buyers dominate intraday direction, and it is flagged as overbought, so a pause or pullback is possible. The Awesome Oscillator (AO) remains neutral and does not signal an extension higher. APA advanced $1.77 (3.93%) today after opening with an upside gap of around $0.30 (0.67%), now trading near session highs. Intraday volatility stands at 3.62%. Strength is evident toward highs, in line with momentum signals, but several oscillators flag overheated market conditions.
Earlier, analysts noted that APA shares were under persistent bearish pressure, with technical indicators and moving averages suggesting downside risks. The current analysis signals a clear shift to bullish momentum, and traders should now watch for sustained price action above the $46.89 resistance as confirmation of a breakout or evidence of a potential reversal if the level fails.






Latest APA Corporation News





-
 Afghanistan
-
 Albania
-
 Algeria
-
 Angola
-
 Argentina
-
 Armenia
-
 Australia
-
 Austria
-
 Azerbaijan
-
 Bahamas
-
 Bahrain
-
 Bangladesh
-
 Belarus
-
 Belgium
-
 Bolivia
-
 Botswana
-
 Brazil
-
 Brunei
-
 Bulgaria
-
 Cambodia
-
 Cameroon
-
 Canada
-
 Chile
-
 China
-
 Colombia
-
 Congo
-
 Costa Rica
-
 Cote d'Ivoire
-
 Croatia
-
 Cuba
-
 Cyprus
-
 Czechia
-
 DR Congo
-
 Denmark
-
 Dominican Republic
-
 Ecuador
-
 Egypt
-
 El Salvador
-
 Estonia
-
 Eswatini
-
 Ethiopia
-
 Finland
-
 France
-
 Georgia
-
 Germany
-
 Ghana
-
 Greece
-
 Haiti
-
 Hong Kong
-
 Hungary
-
 India
-
 Indonesia
-
 Iran, Islamic republic
-
 Iraq
-
 Ireland
-
 Israel
-
 Italy
-
 Jamaica
-
 Japan
-
 Jordan
-
 Kazakhstan
-
 Kenya
-
 Korea
-
 Kuwait
-
 Kyrgyzstan
-
 Laos
-
 Latvia
-
 Lebanon
-
 Lesotho
-
 Libya
-
 Lithuania
-
 Luxembourg
-
 Madagascar
-
 Malaysia
-
 Malta
-
 Mauritius
-
 Mexico
-
 Moldova
-
 Mongolia
-
 Montenegro
-
 Morocco
-
 Mozambique
-
 Myanmar
-
 Namibia
-
 Nepal
-
 Netherlands
-
 New Zealand
-
 Nigeria
-
 North Macedonia
-
 Norway
-
 Oman
-
 Pakistan
-
 Palestine
-
 Panama
-
 Papua New Guinea
-
 Paraguay
-
 Peru
-
 Philippines
-
 Poland
-
 Portugal
-
 Puerto Rico
-
 Qatar
-
 Reunion
-
 Romania
-
 Rwanda
-
 Saudi Arabia
-
 Serbia
-
 Singapore
-
 Slovakia
-
 Slovenia
-
 Somalia
-
 South Africa
-
 Spain
-
 Sri Lanka
-
 Sweden
-
 Switzerland
-
 Syria
-
 Taiwan
-
 Tajikistan
-
 Tanzania
-
 Thailand
-
 Trinidad and Tobago
-
 Tunisia
-
 Turkey
-
 UAE
-
 Uganda
-
 Ukraine
-
 United Kingdom
-
United States
-
 Uruguay
-
 Uzbekistan
-
 Venezuela
-
 Vietnam
-
 Yemen
-
 Zambia
-
 Zimbabwe
- Forex
- Crypto












