

National Grid stock forecast: Downside risk grows as price nears key support after latest drop

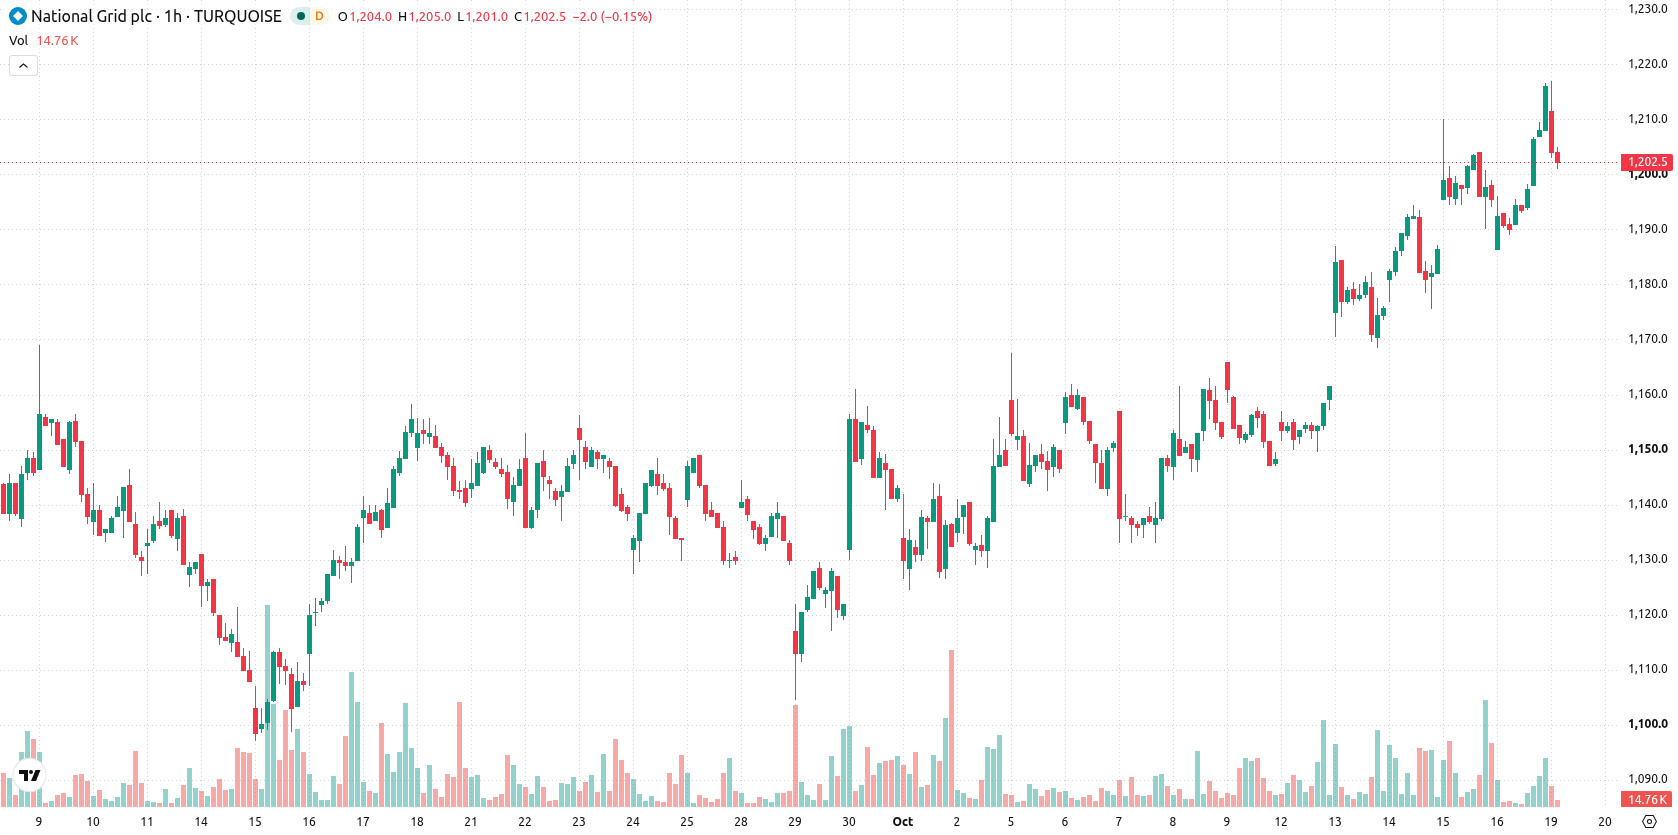
National Grid (NG) stock is trading at GBX1,202, marking a daily decline of 1.13%. The price is positioned above its key short- and medium-term moving averages but remains below longer-term benchmarks.
 1261.50
1262.50
Highlights
- NG/GBX trades above short- and medium-term moving averages but remains below the long-term trend indicator.
- Momentum indicators confirm strong buying pressure, but multiple signals show the asset is currently overbought.
- The projected trading range for the next 2 to 3 days is GBX1,180 to GBX1,231, with immediate support at GBX1,196 and resistance at GBX1,231.
Buy signals persist as intraday momentum meets overbought warnings
On the hourly chart, NG trades above the MA-20 at GBX1,198 and the MA-50 at GBX1,181, but remains below the MA-200 at GBX1,235. The Ichimoku Kijun at GBX1,196 acts as the nearest support. MACD and ADX both signal buy, and the Awesome Oscillator supports the upward momentum. RSI is elevated at 69.02, while both CCI and Stochastic RSI are also showing overbought conditions, and Bull/Bear Power reflects ongoing buyer dominance intraday. The session closed near today's low with a notable gap and moderate volatility.
Range-bound outlook as consolidation caps near-term direction
Looking ahead to the next 2–3 trading days, price action is expected within a GBX1,180 to GBX1,231 volatility band relative to current levels. The baseline scenario is continued consolidation between immediate support at GBX1,196 and resistance near GBX1,231. If NG breaks above resistance, a move higher may develop; however, a close below GBX1,196 could accelerate the retracement toward the lower end of the expected range.
Earlier, analysts noted that National Grid’s stable dividend policy and improved earnings outlook were supporting a generally constructive technical view. The latest price action reinforces those findings, with overbought signals and narrowing volatility bands highlighting GBX1,196 as a key level to monitor for breakouts or deeper pullbacks in the near term.









-
 Afghanistan
-
 Albania
-
 Algeria
-
 Angola
-
 Argentina
-
 Armenia
-
 Australia
-
 Austria
-
 Azerbaijan
-
 Bahamas
-
 Bahrain
-
 Bangladesh
-
 Belarus
-
 Belgium
-
 Bolivia
-
 Botswana
-
 Brazil
-
 Brunei
-
 Bulgaria
-
 Cambodia
-
 Cameroon
-
 Canada
-
 Chile
-
 China
-
 Colombia
-
 Congo
-
 Costa Rica
-
 Cote d'Ivoire
-
 Croatia
-
 Cuba
-
 Cyprus
-
 Czechia
-
 DR Congo
-
 Denmark
-
 Dominican Republic
-
 Ecuador
-
 Egypt
-
 El Salvador
-
 Estonia
-
 Eswatini
-
 Ethiopia
-
 Finland
-
 France
-
 Georgia
-
 Germany
-
 Ghana
-
 Greece
-
 Haiti
-
 Hong Kong
-
 Hungary
-
 India
-
 Indonesia
-
 Iran, Islamic republic
-
 Iraq
-
 Ireland
-
 Israel
-
 Italy
-
 Jamaica
-
 Japan
-
 Jordan
-
 Kazakhstan
-
 Kenya
-
 Korea
-
 Kuwait
-
 Kyrgyzstan
-
 Laos
-
 Latvia
-
 Lebanon
-
 Lesotho
-
 Libya
-
 Lithuania
-
 Luxembourg
-
 Madagascar
-
 Malaysia
-
 Malta
-
 Mauritius
-
 Mexico
-
 Moldova
-
 Mongolia
-
 Montenegro
-
 Morocco
-
 Mozambique
-
 Myanmar
-
 Namibia
-
 Nepal
-
 Netherlands
-
 New Zealand
-
 Nigeria
-
 North Macedonia
-
 Norway
-
 Oman
-
 Pakistan
-
 Palestine
-
 Panama
-
 Papua New Guinea
-
 Paraguay
-
 Peru
-
 Philippines
-
 Poland
-
 Portugal
-
 Puerto Rico
-
 Qatar
-
 Reunion
-
 Romania
-
 Rwanda
-
 Saudi Arabia
-
 Serbia
-
 Singapore
-
 Slovakia
-
 Slovenia
-
 Somalia
-
 South Africa
-
 Spain
-
 Sri Lanka
-
 Sweden
-
 Switzerland
-
 Syria
-
 Taiwan
-
 Tajikistan
-
 Tanzania
-
 Thailand
-
 Trinidad and Tobago
-
 Tunisia
-
 Turkey
-
 UAE
-
 Uganda
-
 Ukraine
-
 United Kingdom
-
United States
-
 Uruguay
-
 Uzbekistan
-
 Venezuela
-
 Vietnam
-
 Yemen
-
 Zambia
-
 Zimbabwe
- Forex
- Crypto












