

Microsoft stock forecast: Consolidation likely as investors watch $535.96 resistance zone

Microsoft (MSFT) stock is trading at $534.35, ending the session with a modest gain, reflecting a daily increase of 0.96%. The price is positioned above its key short-term averages while remaining just beneath intermediate trend levels.
 524.70
534.70
Highlights
- Microsoft stock faces investor scrutiny ahead of Q1 2027 earnings on October 28, 2026, and upcoming outlook.
- Withdrawal from a planned UK data center project and pending British antitrust decision add uncertainty to the company’s expansion and regulatory risk.
- Shares closed at $534.35 with mixed technical signals; expected range is $522.47 to $546.23 as consolidation dominates short-term movement.
Earnings anticipation and UK regulatory risks as expansion plan stalls
Microsoft is set to release its Q1 2027 earnings on October 28, 2026, according to MarketBeat, sharpening investor focus on the company’s operational performance and future guidance ahead of the event. The recent withdrawal from a planned data center project with Nscale in Loughton, Essex, as reported by Seeking Alpha, introduces uncertainties around Microsoft’s expansion plans in the UK and may influence confidence in its infrastructure growth. At the same time, British regulators are considering enhanced antitrust oversight of Microsoft's business software operations, with a final decision pending in February 2027, Pymnts reported, adding a layer of regulatory risk to the outlook.
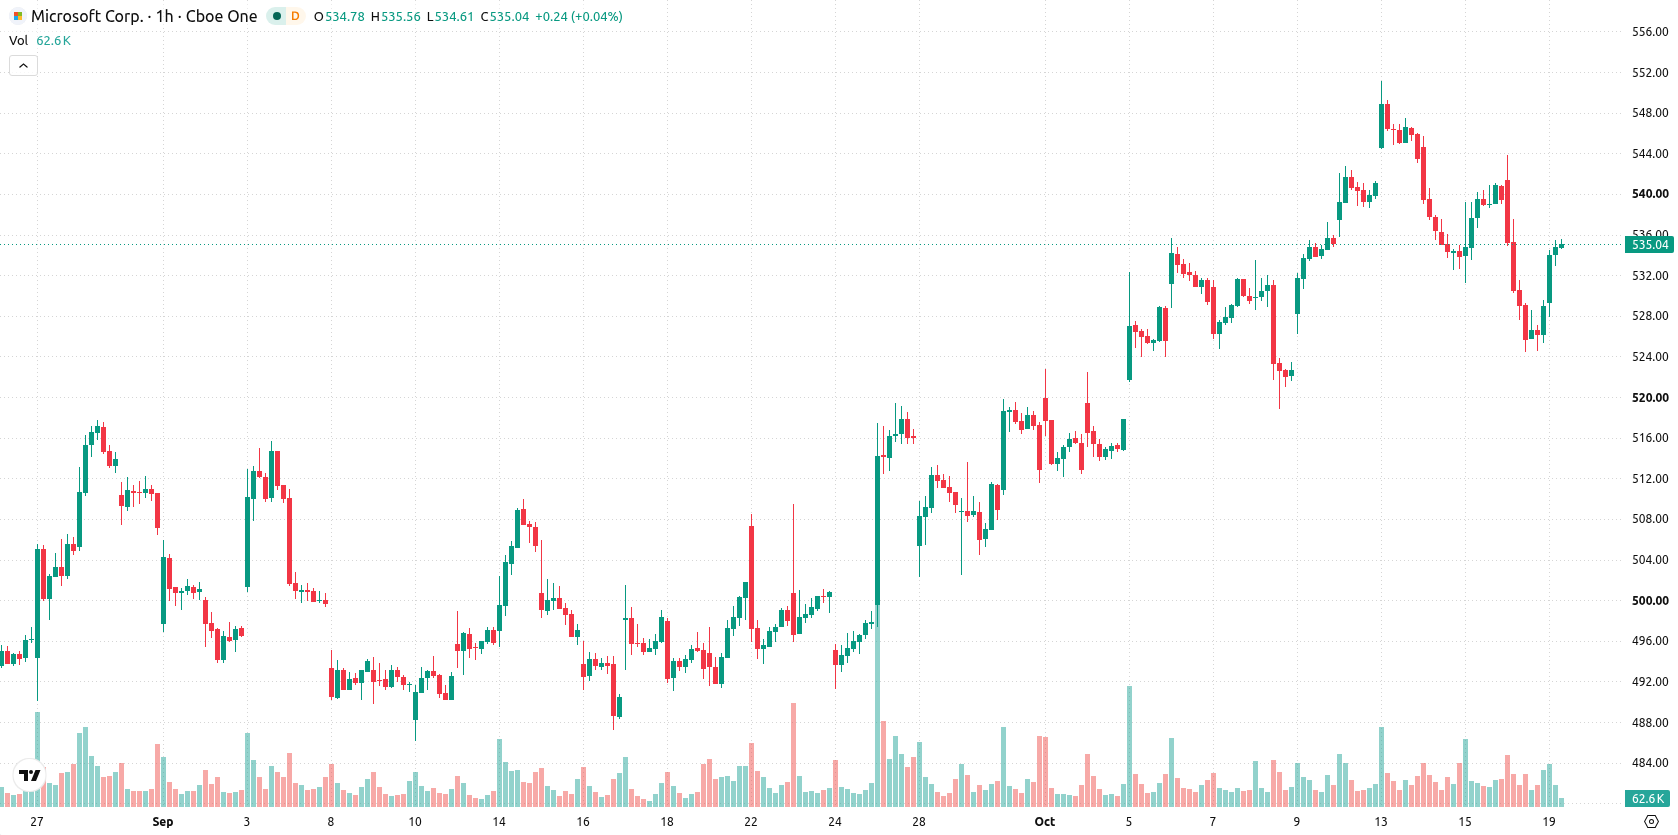
Resistance at Kijun and mixed momentum as sellers dominate intraday
On the technical front, MSFT closed at $534.35, sitting above the MA-20 yet just under the MA-50 on the hourly chart. Immediate resistance is defined by the Ichimoku Kijun at $535.96, with longer-term support well above the MA-200 on the daily timeframe. Momentum indicators remain mixed: MACD and Awesome Oscillator both point to a Sell bias, while ADX is Neutral. RSI, CCI, and Bull/Bear Power all show oversold conditions, reflecting continued seller dominance on an intraday basis. Notably, Stochastic RSI signals a Strong Buy, highlighting some short-term optimism despite the prevailing selling pressure.
Consolidation outlook as upside probability faces resistance test
Looking ahead to the next several sessions, MSFT is expected to trade within a typical volatility band of $522.47 to $546.23. There is a 78% probability of an upward move, while the chance of a decline is estimated at 22%. The baseline scenario suggests near-term consolidation around current levels; a bullish breakout would require a close above the $535.96 resistance zone, whereas a break below $522.47 could trigger a bearish move.
Previously it was reported that concerns over infrastructure constraints and technical resistance levels were contributing to cautious trading in Microsoft stock. The latest data confirms ongoing short-term seller pressure but highlights a pivotal resistance at $535.96, making a sustained breakout above this level a critical indicator for any renewed upward momentum.






Latest Microsoft News





-
 Afghanistan
-
 Albania
-
 Algeria
-
 Angola
-
 Argentina
-
 Armenia
-
 Australia
-
 Austria
-
 Azerbaijan
-
 Bahamas
-
 Bahrain
-
 Bangladesh
-
 Belarus
-
 Belgium
-
 Bolivia
-
 Botswana
-
 Brazil
-
 Brunei
-
 Bulgaria
-
 Cambodia
-
 Cameroon
-
 Canada
-
 Chile
-
 China
-
 Colombia
-
 Congo
-
 Costa Rica
-
 Cote d'Ivoire
-
 Croatia
-
 Cuba
-
 Cyprus
-
 Czechia
-
 DR Congo
-
 Denmark
-
 Dominican Republic
-
 Ecuador
-
 Egypt
-
 El Salvador
-
 Estonia
-
 Eswatini
-
 Ethiopia
-
 Finland
-
 France
-
 Georgia
-
 Germany
-
 Ghana
-
 Greece
-
 Haiti
-
 Hong Kong
-
 Hungary
-
 India
-
 Indonesia
-
 Iran, Islamic republic
-
 Iraq
-
 Ireland
-
 Israel
-
 Italy
-
 Jamaica
-
 Japan
-
 Jordan
-
 Kazakhstan
-
 Kenya
-
 Korea
-
 Kuwait
-
 Kyrgyzstan
-
 Laos
-
 Latvia
-
 Lebanon
-
 Lesotho
-
 Libya
-
 Lithuania
-
 Luxembourg
-
 Madagascar
-
 Malaysia
-
 Malta
-
 Mauritius
-
 Mexico
-
 Moldova
-
 Mongolia
-
 Montenegro
-
 Morocco
-
 Mozambique
-
 Myanmar
-
 Namibia
-
 Nepal
-
 Netherlands
-
 New Zealand
-
 Nigeria
-
 North Macedonia
-
 Norway
-
 Oman
-
 Pakistan
-
 Palestine
-
 Panama
-
 Papua New Guinea
-
 Paraguay
-
 Peru
-
 Philippines
-
 Poland
-
 Portugal
-
 Puerto Rico
-
 Qatar
-
 Reunion
-
 Romania
-
 Rwanda
-
 Saudi Arabia
-
 Serbia
-
 Singapore
-
 Slovakia
-
 Slovenia
-
 Somalia
-
 South Africa
-
 Spain
-
 Sri Lanka
-
 Sweden
-
 Switzerland
-
 Syria
-
 Taiwan
-
 Tajikistan
-
 Tanzania
-
 Thailand
-
 Trinidad and Tobago
-
 Tunisia
-
 Turkey
-
 UAE
-
 Uganda
-
 Ukraine
-
 United Kingdom
-
United States
-
 Uruguay
-
 Uzbekistan
-
 Venezuela
-
 Vietnam
-
 Yemen
-
 Zambia
-
 Zimbabwe
- Forex
- Crypto












