


International Business Machines Corporation (IBM) climbed 2.10% today, with buying interest returning as investors responded to company news that included a recent earnings update and continued dividend increases. The advance looks limited, as IBM remains below its 200-day moving average and technical signals show lingering longer-term bearish pressure.
 242.53
Highlights
- IBM stock remains in a consolidation phase after fiscal Q2 2026 revenue of $17.16 billion missed expectations, rising 1.1% year over year.
- IBM maintains a 30-year streak of annual dividend increases, with a current yield near 2.9% and payout of $1.69 per share.
- Shares of IBM trade with short- and medium-term bullish momentum but face longer-term bearish pressure, with a forecast range of $231.86 to $244.07 and 60% probability of a downward move.
Dividend reliability offsets subdued sentiment after weak Q2 results
IBM has moved through a period of stock price consolidation following a notable decline after its July 2026 earnings release, when executives reported that fiscal Q2 2026 results came in below expectations. The company posted revenue of $17.16 billion for the second quarter, a 1.10% year-over-year rise. IBM continues its three-decade streak of annual dividend increases, with a current quarterly payout of $1.69 per share and an annual yield near 2.9%. New IBM research highlights a strong enterprise focus on AI incident escalation, and the company has introduced a self-hosted AI governance solution to address enterprise AI sovereignty.
Short-term bullish signals amid longer-term technical resistance
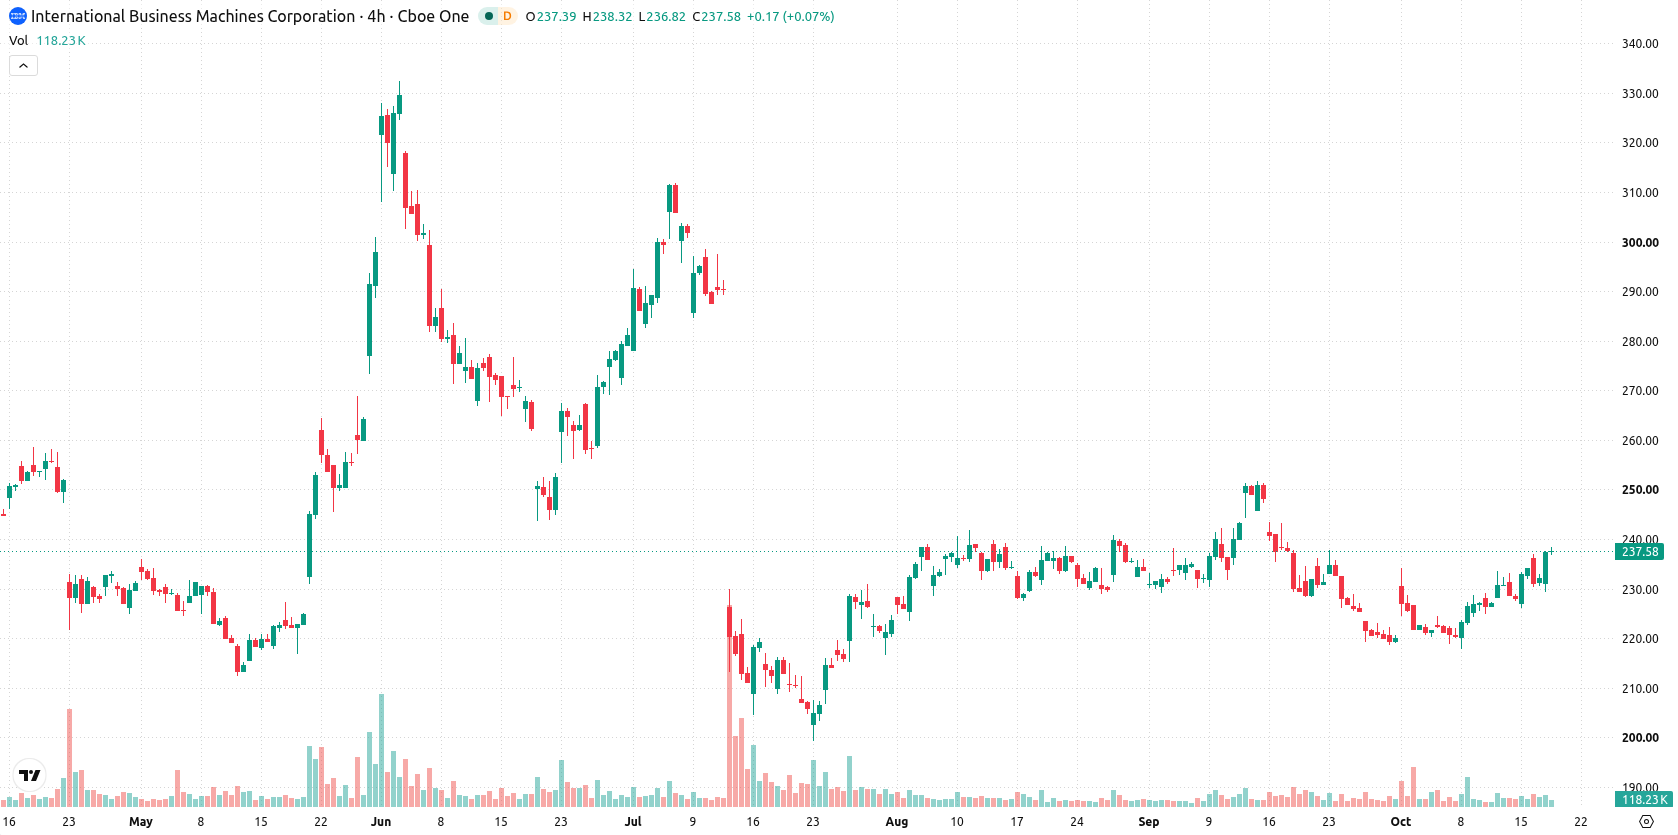
IBM is trading above both the 20-day and 50-day moving averages at $226.34 and $232.04, but remains below the 200-day average at $251.69. This setup points to short- and medium-term bullish momentum, although the extended trend remains under bearish pressure. The immediate resistance is at $238.32, and the nearest support stands at $236.64. Momentum signals are mixed: MACD is signaling a strong sell, ADX is neutral, and the RSI at 53.78 favors buyers. However, both the Stochastic RSI and CCI indicate overbought conditions. Bull/Bear Power at 8.66 reflects intraday buyer dominance, also signaling overbought territory. Price is near the day's highs, with intraday volatility at 3.93%. Oscillators and momentum readings continue to show internal divergence.
Earlier, analysts noted that IBM's prospects were underpinned by advancements in artificial intelligence and cloud partnerships, but tempered by technical resistance and mixed momentum signals. Building on this outlook, the recent earnings miss and continued overbought indicators suggest that traders should closely monitor the $236.64 support level for signs of renewed downside risk in the coming sessions.









-
 Afghanistan
-
 Albania
-
 Algeria
-
 Angola
-
 Argentina
-
 Armenia
-
 Australia
-
 Austria
-
 Azerbaijan
-
 Bahamas
-
 Bahrain
-
 Bangladesh
-
 Belarus
-
 Belgium
-
 Bolivia
-
 Botswana
-
 Brazil
-
 Brunei
-
 Bulgaria
-
 Cambodia
-
 Cameroon
-
 Canada
-
 Chile
-
 China
-
 Colombia
-
 Congo
-
 Costa Rica
-
 Cote d'Ivoire
-
 Croatia
-
 Cuba
-
 Cyprus
-
 Czechia
-
 DR Congo
-
 Denmark
-
 Dominican Republic
-
 Ecuador
-
 Egypt
-
 El Salvador
-
 Estonia
-
 Eswatini
-
 Ethiopia
-
 Finland
-
 France
-
 Georgia
-
 Germany
-
 Ghana
-
 Greece
-
 Haiti
-
 Hong Kong
-
 Hungary
-
 India
-
 Indonesia
-
 Iran, Islamic republic
-
 Iraq
-
 Ireland
-
 Israel
-
 Italy
-
 Jamaica
-
 Japan
-
 Jordan
-
 Kazakhstan
-
 Kenya
-
 Korea
-
 Kuwait
-
 Kyrgyzstan
-
 Laos
-
 Latvia
-
 Lebanon
-
 Lesotho
-
 Libya
-
 Lithuania
-
 Luxembourg
-
 Madagascar
-
 Malaysia
-
 Malta
-
 Mauritius
-
 Mexico
-
 Moldova
-
 Mongolia
-
 Montenegro
-
 Morocco
-
 Mozambique
-
 Myanmar
-
 Namibia
-
 Nepal
-
 Netherlands
-
 New Zealand
-
 Nigeria
-
 North Macedonia
-
 Norway
-
 Oman
-
 Pakistan
-
 Palestine
-
 Panama
-
 Papua New Guinea
-
 Paraguay
-
 Peru
-
 Philippines
-
 Poland
-
 Portugal
-
 Puerto Rico
-
 Qatar
-
 Reunion
-
 Romania
-
 Rwanda
-
 Saudi Arabia
-
 Serbia
-
 Singapore
-
 Slovakia
-
 Slovenia
-
 Somalia
-
 South Africa
-
 Spain
-
 Sri Lanka
-
 Sweden
-
 Switzerland
-
 Syria
-
 Taiwan
-
 Tajikistan
-
 Tanzania
-
 Thailand
-
 Trinidad and Tobago
-
 Tunisia
-
 Turkey
-
 UAE
-
 Uganda
-
 Ukraine
-
 United Kingdom
-
United States
-
 Uruguay
-
 Uzbekistan
-
 Venezuela
-
 Vietnam
-
 Yemen
-
 Zambia
-
 Zimbabwe
- Forex
- Crypto












