

Vodafone stock price prediction: Bearish pressure dominates short-term outlook

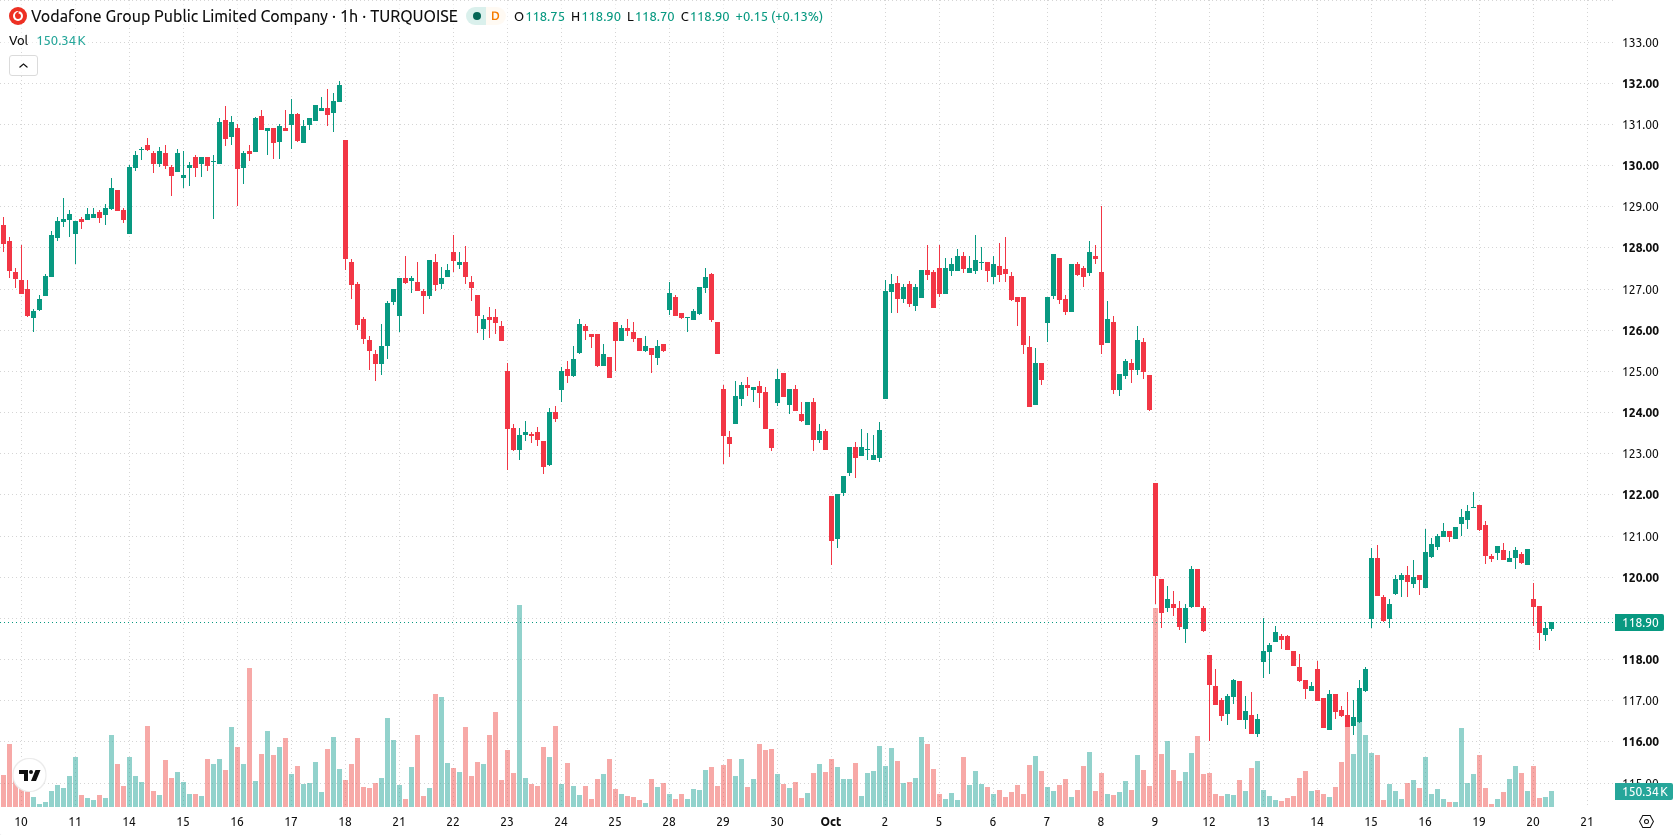
Vodafone (VOD) stock is trading at GBX119.05, down 1.29% on the day, reflecting a negative sentiment. The price currently sits below its key short- and medium-term moving averages but remains supported by the long-term trend.
 120.20
122.10
Highlights
- Vodafone signed a letter of intent with Deutsche Telekom, Orange, and Telefónica to explore a joint spectrum bid for Mobile Satellite Services and direct-to-device technology in Europe.
- The agreement remains in the exploratory phase and has not produced immediate commercial benefits or near-term catalysts for Vodafone stock.
- Shares of Vodafone are trading below key moving averages with mixed but generally bearish technical signals and are expected to fluctuate between GBX116.39 to GBX121.71 over the next four days, with a 79% probability of further downside.
Satellite bid exploration underscores sector ambition amid muted catalyst effect
On October 19, 2026, Vodafone signed a letter of intent with Deutsche Telekom, Orange, and Telefónica to explore a joint bid for spectrum allocation aimed at advancing Mobile Satellite Services and direct-to-device capabilities across Europe, according to Mobileworldlive. This step marks a concrete move to strengthen Vodafone's positioning in expanding satellite and mobile connectivity markets, though the agreement remains at the exploratory stage and has yet to deliver immediate commercial benefit. Broader market sentiment around the stock continues to reflect the absence of direct catalysts from the development.
Layered technical barriers as oversold momentum intensifies downside risk
On the H1 timeframe, VOD is trading below both its MA-20 and MA-50, while remaining above the MA-200 level, underscoring a layered technical picture. The Ichimoku Kijun at GBX120.18 serves as immediate resistance, capping any near-term rebound attempts. RSI is currently at 35.64, with both CCI and Stochastic RSI reading in oversold territory, and Bull/Bear Power confirming sellers remain dominant. MACD and ADX register neutral signals, while the Awesome Oscillator issues a strong sell, aligning with prevailing downside momentum.
Further declines likely unless resistance breached amid bearish scenario
Over the next four trading days, VOD is expected to remain within a volatility band between GBX116.39 and GBX121.71. There is a 79% probability of further downside, while a break above GBX120.18 would be required to shift the outlook to a bullish scenario. If downside momentum prevails and prices fall through the lower support, this would trigger a bearish extension, opening up additional lower targets.
Earlier, analysts noted that concerns over Vodafone's dividend sustainability and downside momentum had established a cautious technical outlook for the stock. The latest developments strengthen this view, with downside risk prevailing in the near term and GBX120.18 highlighted as the key level that must be reclaimed to signal any potential shift in trend.








-
 Afghanistan
-
 Albania
-
 Algeria
-
 Angola
-
 Argentina
-
 Armenia
-
 Australia
-
 Austria
-
 Azerbaijan
-
 Bahamas
-
 Bahrain
-
 Bangladesh
-
 Belarus
-
 Belgium
-
 Bolivia
-
 Botswana
-
 Brazil
-
 Brunei
-
 Bulgaria
-
 Cambodia
-
 Cameroon
-
 Canada
-
 Chile
-
 China
-
 Colombia
-
 Congo
-
 Costa Rica
-
 Cote d'Ivoire
-
 Croatia
-
 Cuba
-
 Cyprus
-
 Czechia
-
 DR Congo
-
 Denmark
-
 Dominican Republic
-
 Ecuador
-
 Egypt
-
 El Salvador
-
 Estonia
-
 Eswatini
-
 Ethiopia
-
 Finland
-
 France
-
 Georgia
-
 Germany
-
 Ghana
-
 Greece
-
 Haiti
-
 Hong Kong
-
 Hungary
-
 India
-
 Indonesia
-
 Iran, Islamic republic
-
 Iraq
-
 Ireland
-
 Israel
-
 Italy
-
 Jamaica
-
 Japan
-
 Jordan
-
 Kazakhstan
-
 Kenya
-
 Korea
-
 Kuwait
-
 Kyrgyzstan
-
 Laos
-
 Latvia
-
 Lebanon
-
 Lesotho
-
 Libya
-
 Lithuania
-
 Luxembourg
-
 Madagascar
-
 Malaysia
-
 Malta
-
 Mauritius
-
 Mexico
-
 Moldova
-
 Mongolia
-
 Montenegro
-
 Morocco
-
 Mozambique
-
 Myanmar
-
 Namibia
-
 Nepal
-
 Netherlands
-
 New Zealand
-
 Nigeria
-
 North Macedonia
-
 Norway
-
 Oman
-
 Pakistan
-
 Palestine
-
 Panama
-
 Papua New Guinea
-
 Paraguay
-
 Peru
-
 Philippines
-
 Poland
-
 Portugal
-
 Puerto Rico
-
 Qatar
-
 Reunion
-
 Romania
-
 Rwanda
-
 Saudi Arabia
-
 Serbia
-
 Singapore
-
 Slovakia
-
 Slovenia
-
 Somalia
-
 South Africa
-
 Spain
-
 Sri Lanka
-
 Sweden
-
 Switzerland
-
 Syria
-
 Taiwan
-
 Tajikistan
-
 Tanzania
-
 Thailand
-
 Trinidad and Tobago
-
 Tunisia
-
 Turkey
-
 UAE
-
 Uganda
-
 Ukraine
-
 United Kingdom
-
United States
-
 Uruguay
-
 Uzbekistan
-
 Venezuela
-
 Vietnam
-
 Yemen
-
 Zambia
-
 Zimbabwe
- Forex
- Crypto












