

Home Depot stock momentum overextends with technical indicators signaling risk: weekly analysis

Shares of Home Depot, Inc (HD) are trading near $315 after a week that saw a solid advance of nearly 2%. The technical picture is being shaped by growing overbought signals, with buyers pressing up against a key resistance zone. This coming week, the focus turns to whether momentum can hold as traders navigate elevated volatility and conflicting market signals.
 330.46
Highlights
- Shares of Home Depot ended the week at $315, gaining $5.45 or 1.78% at the top of a volatile 8.62% range.
- The price sits above short- and medium-term moving averages but remains below long-term trend levels, indicating lingering bearish structure.
- Momentum indicators show overbought conditions as the stock is rangebound between $314.57 and resistance at $336.12, with a projected five-day range of $302.25 to $326.16.
Institutional inflows and shifting profitability shape sentiment in the week
Several large institutional investors have either increased or opened new positions in HD during the third quarter of 2026, according to MarketBeat. Meanwhile, the company continues to attract attention for its higher dividend yield compared to Lowe's, as highlighted by 24/7 Wall St. and Pluang. The The Motley Fool also notes a recent decline in HD's profitability, even as its professional contractor business expands, and management has reiterated their supply chain diversification efforts in a May 2025 call (source: Trefis).
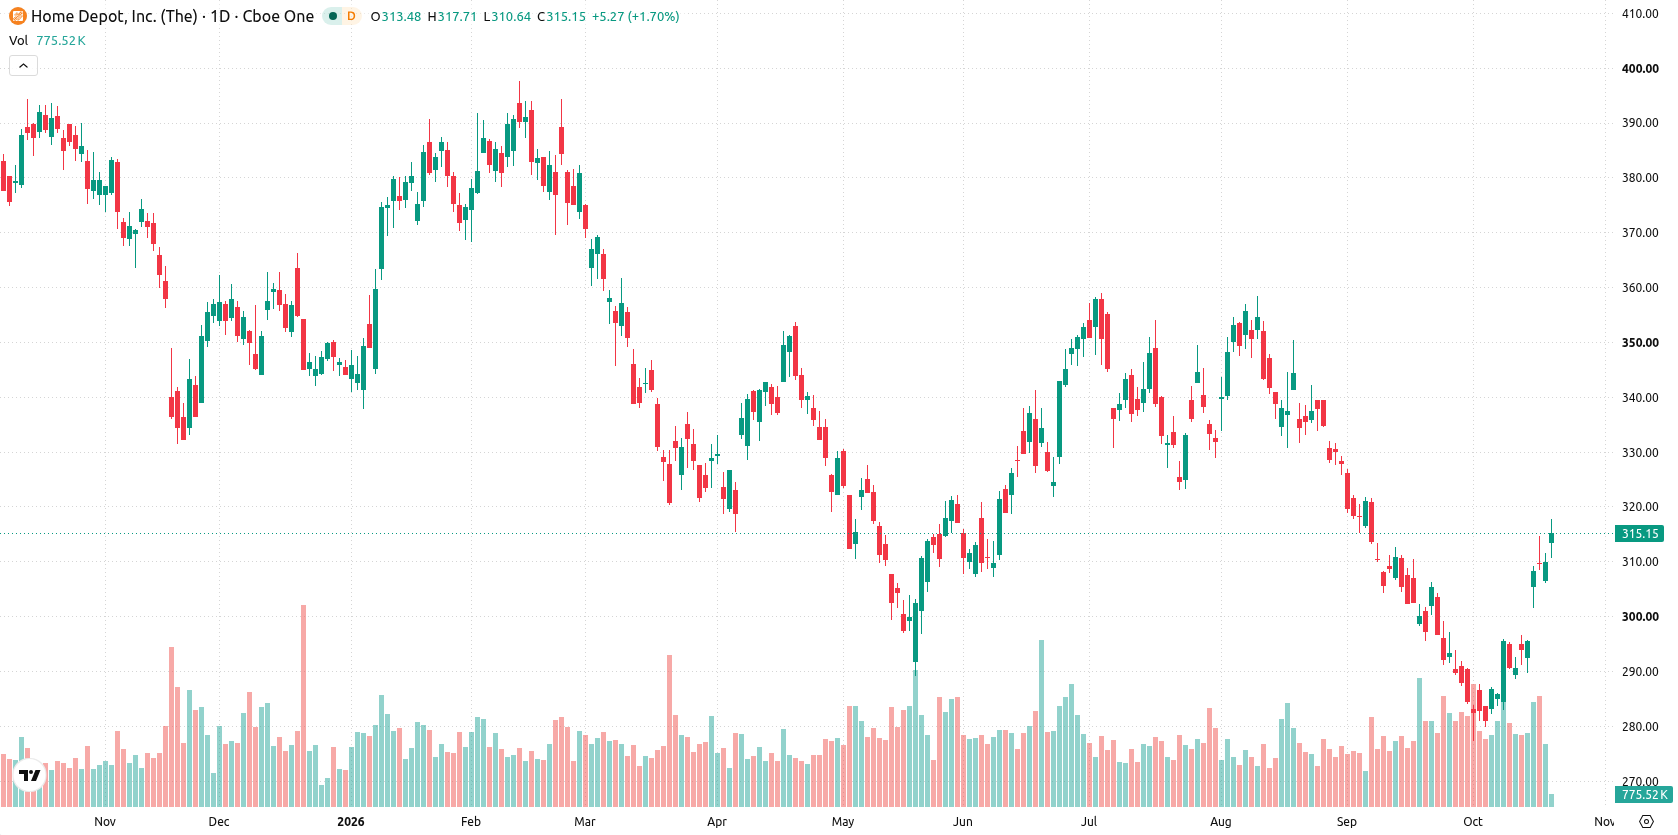
Overbought signals intensify as price action stalls at major resistance
The daily chart shows momentum shifting into overbought territory, with the CCI at 167.18 and Stoch RSI at 100, while the RSI is also approaching overbought conditions. Bull/Bear Power indicates continued buyer dominance, but these strong signals are tempered by the fact that the price is sitting on weekly resistance at $314.57 and remains capped by the higher MA-200 at $336.12. The current move features a sustained move higher with a firm trend, but growing overbought signals introduce the risk of a reversal as volatility remains elevated.
Balanced outlook persists with breakout risk if key levels are breached
Over the next five trading days, the expected range is $302.25 to $326.16, with a balanced 50% probability of increase or decrease. The base case is for the stock to oscillate between support at $314.57 and resistance at $336.12. A sustained push above $336.12 would open the way to further upside, while a break below $314.57 would leave the stock vulnerable to deeper retracement toward the lower end of the expected range.
Earlier, analysts noted that Home Depot was exhibiting upside momentum but flagged the risk of near-term pullbacks due to overbought signals and technical resistance. With institutional investors increasing exposure and volatility remaining elevated, traders should monitor whether the stock can sustain levels above $336.12 to confirm a breakout or risk a deeper retracement if support at $314.57 fails.






Latest Home Depot News



-
 Afghanistan
-
 Albania
-
 Algeria
-
 Angola
-
 Argentina
-
 Armenia
-
 Australia
-
 Austria
-
 Azerbaijan
-
 Bahamas
-
 Bahrain
-
 Bangladesh
-
 Belarus
-
 Belgium
-
 Bolivia
-
 Botswana
-
 Brazil
-
 Brunei
-
 Bulgaria
-
 Cambodia
-
 Cameroon
-
 Canada
-
 Chile
-
 China
-
 Colombia
-
 Congo
-
 Costa Rica
-
 Cote d'Ivoire
-
 Croatia
-
 Cuba
-
 Cyprus
-
 Czechia
-
 DR Congo
-
 Denmark
-
 Dominican Republic
-
 Ecuador
-
 Egypt
-
 El Salvador
-
 Estonia
-
 Eswatini
-
 Ethiopia
-
 Finland
-
 France
-
 Georgia
-
 Germany
-
 Ghana
-
 Greece
-
 Haiti
-
 Hong Kong
-
 Hungary
-
 India
-
 Indonesia
-
 Iran, Islamic republic
-
 Iraq
-
 Ireland
-
 Israel
-
 Italy
-
 Jamaica
-
 Japan
-
 Jordan
-
 Kazakhstan
-
 Kenya
-
 Korea
-
 Kuwait
-
 Kyrgyzstan
-
 Laos
-
 Latvia
-
 Lebanon
-
 Lesotho
-
 Libya
-
 Lithuania
-
 Luxembourg
-
 Madagascar
-
 Malaysia
-
 Malta
-
 Mauritius
-
 Mexico
-
 Moldova
-
 Mongolia
-
 Montenegro
-
 Morocco
-
 Mozambique
-
 Myanmar
-
 Namibia
-
 Nepal
-
 Netherlands
-
 New Zealand
-
 Nigeria
-
 North Macedonia
-
 Norway
-
 Oman
-
 Pakistan
-
 Palestine
-
 Panama
-
 Papua New Guinea
-
 Paraguay
-
 Peru
-
 Philippines
-
 Poland
-
 Portugal
-
 Puerto Rico
-
 Qatar
-
 Reunion
-
 Romania
-
 Rwanda
-
 Saudi Arabia
-
 Serbia
-
 Singapore
-
 Slovakia
-
 Slovenia
-
 Somalia
-
 South Africa
-
 Spain
-
 Sri Lanka
-
 Sweden
-
 Switzerland
-
 Syria
-
 Taiwan
-
 Tajikistan
-
 Tanzania
-
 Thailand
-
 Trinidad and Tobago
-
 Tunisia
-
 Turkey
-
 UAE
-
 Uganda
-
 Ukraine
-
 United Kingdom
-
United States
-
 Uruguay
-
 Uzbekistan
-
 Venezuela
-
 Vietnam
-
 Yemen
-
 Zambia
-
 Zimbabwe
- Forex
- Crypto












