

What's behind Ultralife's latest 3.8% stock surge?

Ultralife Corporation (ULBI) rose 3.81% today as a short-term technical bounce propelled buying interest, with immediate momentum supported by recovery from a downside gap. The move looks limited, as the stock remains under both its 50- and 200-day moving averages and faces resistance near $6.32.
 15.70
15.78
Highlights
- Ultralife stock trades in a narrow range above $6.24 support but below $6.32 resistance, with recent session strength.
- Technical indicators show mixed momentum, with several readings bearish and the stock deep in oversold territory.
- Forecast for the next five sessions sets a likely sideways pattern between $5.94 and $6.35, with 79% probability of a downward move.
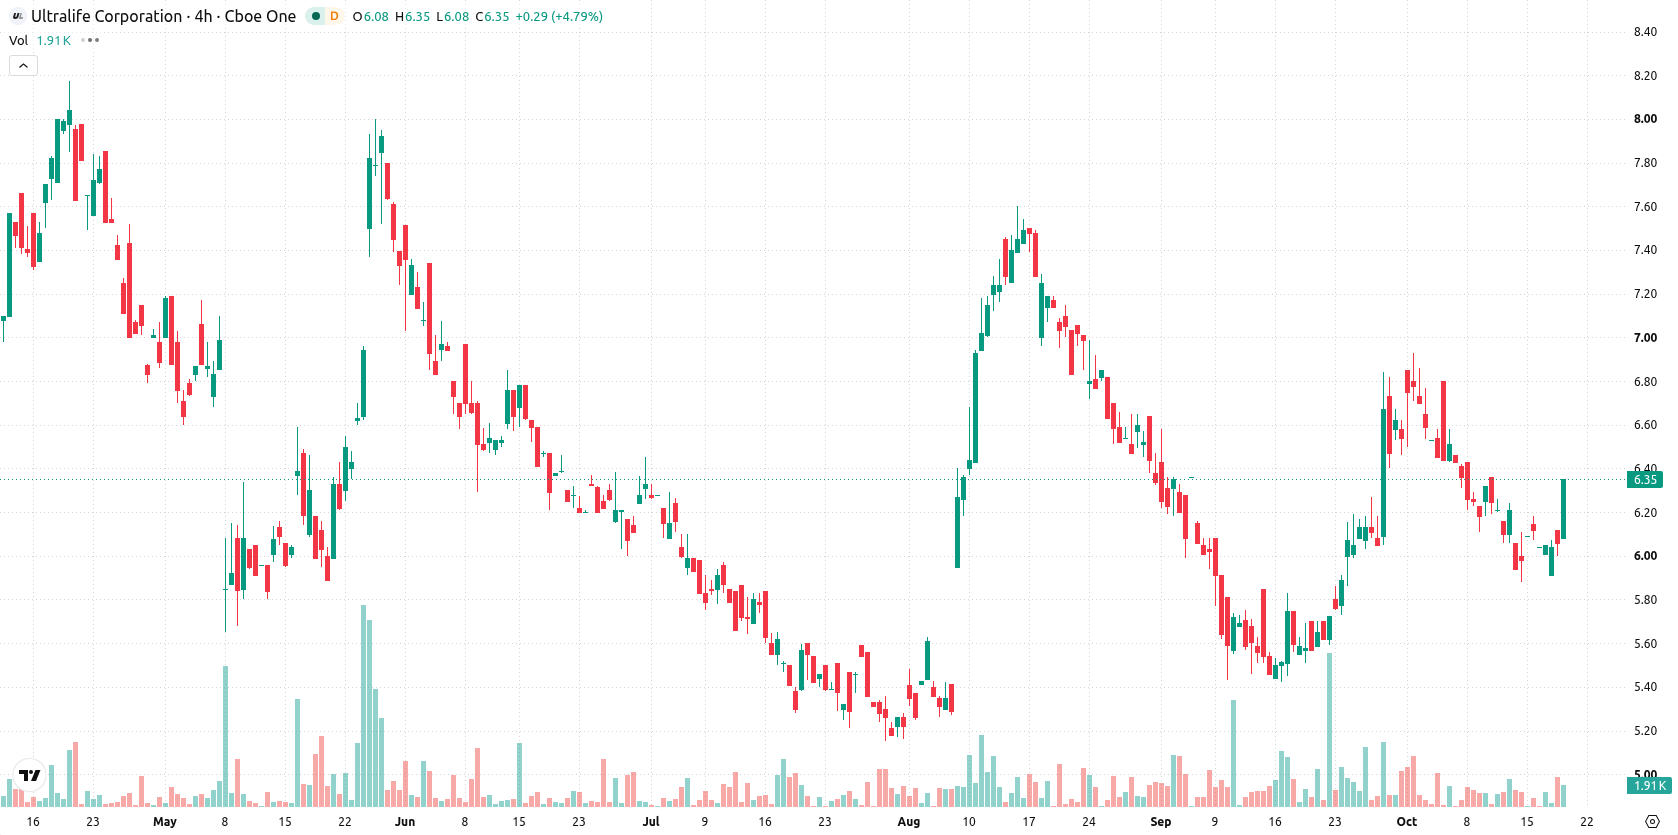
Mixed momentum as oversold signals offset resistance barriers
Ultralife is trading above its 20-day moving average (MA-20) at $6.24, but remains below both its 50-day (MA-50 at $6.33) and 200-day (MA-200 at $6.32) moving averages. Short-term sentiment shows some bullish pressure, while the medium- and longer-term trends remain under resistance, with the broader alignment of MA-50 versus MA-200 still bullish. The immediate floor is at $6.24, and the ceiling sits at $6.32. Momentum readings are mixed: MACD and Average Directional Index (ADX) both signal neutrality, suggesting no clear directional strength intraday. Relative Strength Index (RSI), Commodity Channel Index (CCI), and Bull/Bear Power (BBP) all lean bearish, with the Stochastic RSI deep in oversold territory at 7.38, pointing to technical oversold conditions. Sellers are dominating the session per BBP, but the HMA gives a strong buy signal and Awesome Oscillator (AO) is aligned neutrally. Today, the stock has gained $0.23 or 3.81%, opening with a downside gap of about $0.03 (roughly -0.5%) before recovering near session highs. Intraday volatility stands at 1.83%, and price is holding close to its daily peak. Despite some oversold readings, near-term momentum fails to confirm a bullish turn, indicating mixed technical signals.
Earlier, analysts noted that Ultralife was exhibiting consolidative price action with a prevailing upward bias supported by strong technical and ownership dynamics. The current analysis introduces a shift, highlighting mixed momentum and a higher probability of downside risk, making the $6.24 support a pivotal level to watch for confirmation of trend direction.











-
 Afghanistan
-
 Albania
-
 Algeria
-
 Angola
-
 Argentina
-
 Armenia
-
 Australia
-
 Austria
-
 Azerbaijan
-
 Bahamas
-
 Bahrain
-
 Bangladesh
-
 Belarus
-
 Belgium
-
 Bolivia
-
 Botswana
-
 Brazil
-
 Brunei
-
 Bulgaria
-
 Cambodia
-
 Cameroon
-
 Canada
-
 Chile
-
 China
-
 Colombia
-
 Congo
-
 Costa Rica
-
 Cote d'Ivoire
-
 Croatia
-
 Cuba
-
 Cyprus
-
 Czechia
-
 DR Congo
-
 Denmark
-
 Dominican Republic
-
 Ecuador
-
 Egypt
-
 El Salvador
-
 Estonia
-
 Eswatini
-
 Ethiopia
-
 Finland
-
 France
-
 Georgia
-
 Germany
-
 Ghana
-
 Greece
-
 Haiti
-
 Hong Kong
-
 Hungary
-
 India
-
 Indonesia
-
 Iran, Islamic republic
-
 Iraq
-
 Ireland
-
 Israel
-
 Italy
-
 Jamaica
-
 Japan
-
 Jordan
-
 Kazakhstan
-
 Kenya
-
 Korea
-
 Kuwait
-
 Kyrgyzstan
-
 Laos
-
 Latvia
-
 Lebanon
-
 Lesotho
-
 Libya
-
 Lithuania
-
 Luxembourg
-
 Madagascar
-
 Malaysia
-
 Malta
-
 Mauritius
-
 Mexico
-
 Moldova
-
 Mongolia
-
 Montenegro
-
 Morocco
-
 Mozambique
-
 Myanmar
-
 Namibia
-
 Nepal
-
 Netherlands
-
 New Zealand
-
 Nigeria
-
 North Macedonia
-
 Norway
-
 Oman
-
 Pakistan
-
 Palestine
-
 Panama
-
 Papua New Guinea
-
 Paraguay
-
 Peru
-
 Philippines
-
 Poland
-
 Portugal
-
 Puerto Rico
-
 Qatar
-
 Reunion
-
 Romania
-
 Rwanda
-
 Saudi Arabia
-
 Serbia
-
 Singapore
-
 Slovakia
-
 Slovenia
-
 Somalia
-
 South Africa
-
 Spain
-
 Sri Lanka
-
 Sweden
-
 Switzerland
-
 Syria
-
 Taiwan
-
 Tajikistan
-
 Tanzania
-
 Thailand
-
 Trinidad and Tobago
-
 Tunisia
-
 Turkey
-
 UAE
-
 Uganda
-
 Ukraine
-
 United Kingdom
-
United States
-
 Uruguay
-
 Uzbekistan
-
 Venezuela
-
 Vietnam
-
 Yemen
-
 Zambia
-
 Zimbabwe
- Forex
- Crypto












