

What's behind CarMax's latest 2.9% stock surge?

CarMax Inc (KMX) rose 2.9% after being recognized as one of the 2026 Fortune Best Workplaces in Retail, ranking #6 among large companies. The move looks limited, as the shares remain below both their 20- and 50-day moving averages, with resistance nearby.
 56.84
56.84
Highlights
- CarMax was ranked #6 among large companies on the 2026 Fortune Best Workplaces in Retail list for the 12th straight year.
- Darren W. Woodell will become Vice President, Controller, and Chief Accounting Officer of CarMax effective November 11, 2026.
- Shares of CarMax trade below key short- and medium-term moving averages, with technicals signaling bearish momentum and an 80% probability of a move to the $50.45 to $55.84 range in the next five sessions.
Recognition and leadership changes offset by institutional selling trend
CarMax was named one of the 2026 Fortune Best Workplaces in Retail for the 12th consecutive year, achieving a #6 ranking among large companies. The company also appointed Darren W. Woodell as Vice President, Controller, and Chief Accounting Officer, effective November 11, 2026. Recent months saw institutional activity, highlighted by a reduction in holdings by the State of Alaska Department of Revenue.
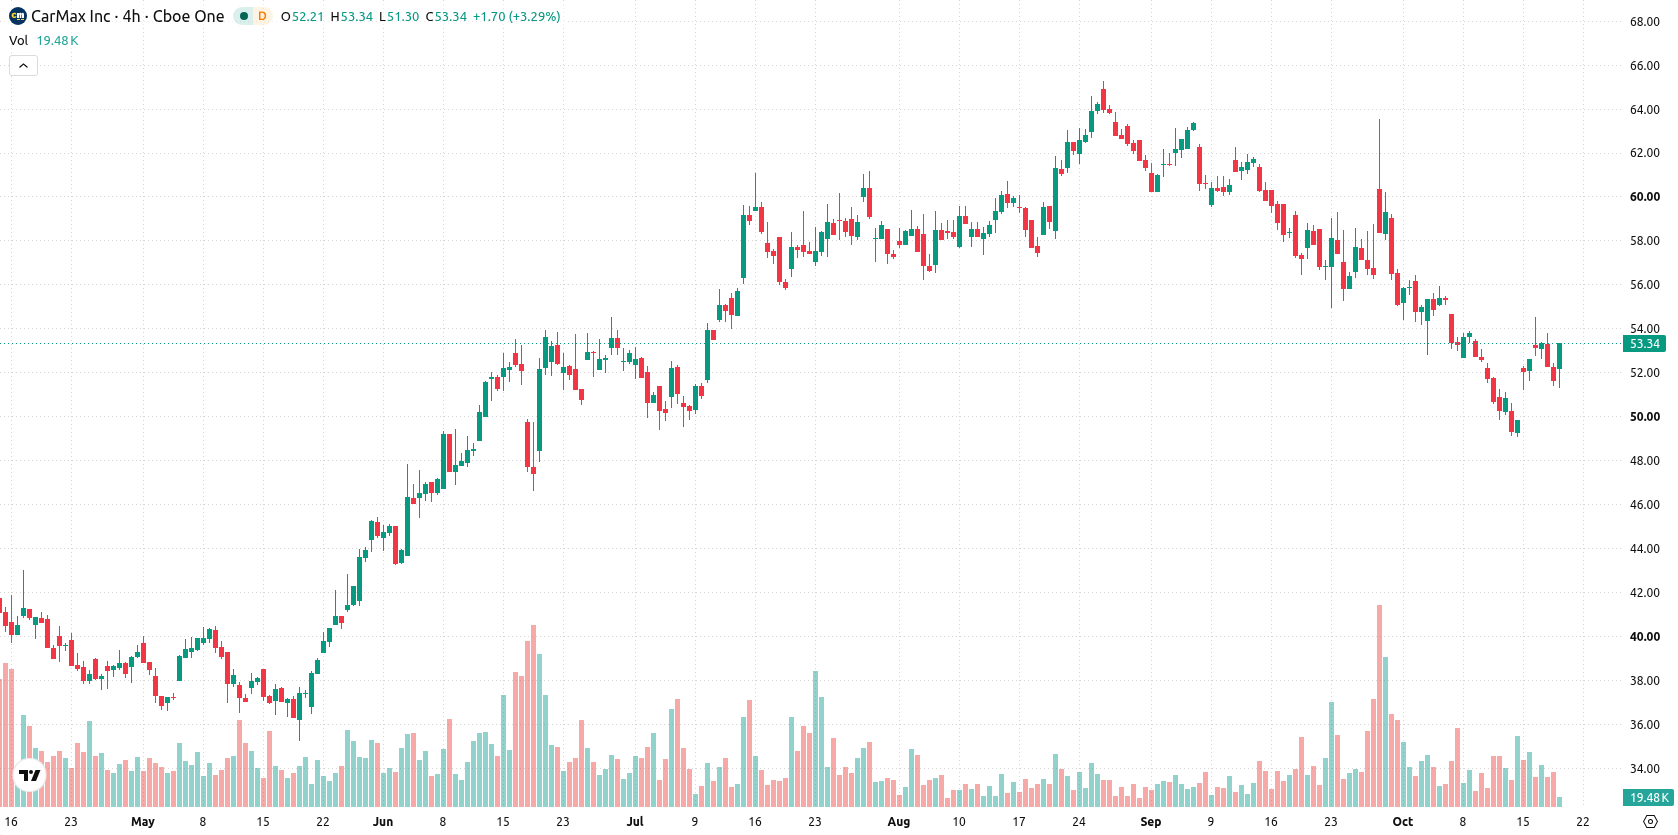
Intraday gains counteracted by sustained technical weakness signals
CarMax is trading below its MA-20 ($54.42) and MA-50 ($58.08), indicating near-term and medium-term selling pressure, though the price still holds above its MA-200 ($48.93) for long-term support. The Ichimoku Kijun at $55.66 signals nearby resistance, with support at $51.39 and resistance at $53.8. MACD and ADX show a sell bias, while the RSI at 39.38 and CCI at -70.94 suggest mildly oversold conditions. The Stochastic RSI is neutral near 69.18, and Bull/Bear Power at 0.68 signals intraday buyer strength but hints at overbought levels. The session recorded a $1.87 upside gap and a $1.5 rise, pushing the price to session highs with volatility at 4.69%. Intraday strength contrasts with signals of trend weakness and possible exhaustion.
Earlier, analysts noted that CarMax's enhanced price transparency and compliance initiatives were expected to strengthen its competitive position and support further market share gains. With near-term technical indicators suggesting heightened volatility and a high probability of a downward move, traders should closely watch for consolidation within the $50.45 to $55.84 range as the next directional signal.






Latest CarMax Inc News





-
 Afghanistan
-
 Albania
-
 Algeria
-
 Angola
-
 Argentina
-
 Armenia
-
 Australia
-
 Austria
-
 Azerbaijan
-
 Bahamas
-
 Bahrain
-
 Bangladesh
-
 Belarus
-
 Belgium
-
 Bolivia
-
 Botswana
-
 Brazil
-
 Brunei
-
 Bulgaria
-
 Cambodia
-
 Cameroon
-
 Canada
-
 Chile
-
 China
-
 Colombia
-
 Congo
-
 Costa Rica
-
 Cote d'Ivoire
-
 Croatia
-
 Cuba
-
 Cyprus
-
 Czechia
-
 DR Congo
-
 Denmark
-
 Dominican Republic
-
 Ecuador
-
 Egypt
-
 El Salvador
-
 Estonia
-
 Eswatini
-
 Ethiopia
-
 Finland
-
 France
-
 Georgia
-
 Germany
-
 Ghana
-
 Greece
-
 Haiti
-
 Hong Kong
-
 Hungary
-
 India
-
 Indonesia
-
 Iran, Islamic republic
-
 Iraq
-
 Ireland
-
 Israel
-
 Italy
-
 Jamaica
-
 Japan
-
 Jordan
-
 Kazakhstan
-
 Kenya
-
 Korea
-
 Kuwait
-
 Kyrgyzstan
-
 Laos
-
 Latvia
-
 Lebanon
-
 Lesotho
-
 Libya
-
 Lithuania
-
 Luxembourg
-
 Madagascar
-
 Malaysia
-
 Malta
-
 Mauritius
-
 Mexico
-
 Moldova
-
 Mongolia
-
 Montenegro
-
 Morocco
-
 Mozambique
-
 Myanmar
-
 Namibia
-
 Nepal
-
 Netherlands
-
 New Zealand
-
 Nigeria
-
 North Macedonia
-
 Norway
-
 Oman
-
 Pakistan
-
 Palestine
-
 Panama
-
 Papua New Guinea
-
 Paraguay
-
 Peru
-
 Philippines
-
 Poland
-
 Portugal
-
 Puerto Rico
-
 Qatar
-
 Reunion
-
 Romania
-
 Rwanda
-
 Saudi Arabia
-
 Serbia
-
 Singapore
-
 Slovakia
-
 Slovenia
-
 Somalia
-
 South Africa
-
 Spain
-
 Sri Lanka
-
 Sweden
-
 Switzerland
-
 Syria
-
 Taiwan
-
 Tajikistan
-
 Tanzania
-
 Thailand
-
 Trinidad and Tobago
-
 Tunisia
-
 Turkey
-
 UAE
-
 Uganda
-
 Ukraine
-
 United Kingdom
-
United States
-
 Uruguay
-
 Uzbekistan
-
 Venezuela
-
 Vietnam
-
 Yemen
-
 Zambia
-
 Zimbabwe
- Forex
- Crypto












