


MSCI Inc (MSCI) jumped 3.87% after posting strong third-quarter earnings and a double-digit revenue increase, highlighting robust operational momentum. The rally is further supported by MSCI trading above all major moving averages and holding firm technical trend support.
 626.16
Highlights
- MSCI stock delivered third-quarter 2026 earnings per share of $5.11, exceeding analyst estimates on revenue of $892 million, up 12.4% year over year.
- Net income increased 7.9% to $351 million, as the board approved a fourth-quarter dividend of $2.05 per share and completed $552.3 million in share repurchases.
- MSCI stock trades in a bullish technical setup with support at $576.61, resistance at $628.14, and a 63% probability of an upward move over the next five days.
Earnings beat drives sentiment shift amid buybacks and dividend boost
MSCI Inc reported third-quarter 2026 earnings per share of $5.11, surpassing analyst expectations. The company achieved $892 million in revenue, marking a 12.4% year-over-year increase, as higher asset-based fees boosted its index segment. Net income rose by 7.9% to $351 million, with the board declaring a fourth-quarter dividend of $2.05 per share and executing $552.3 million in share repurchases during the quarter.
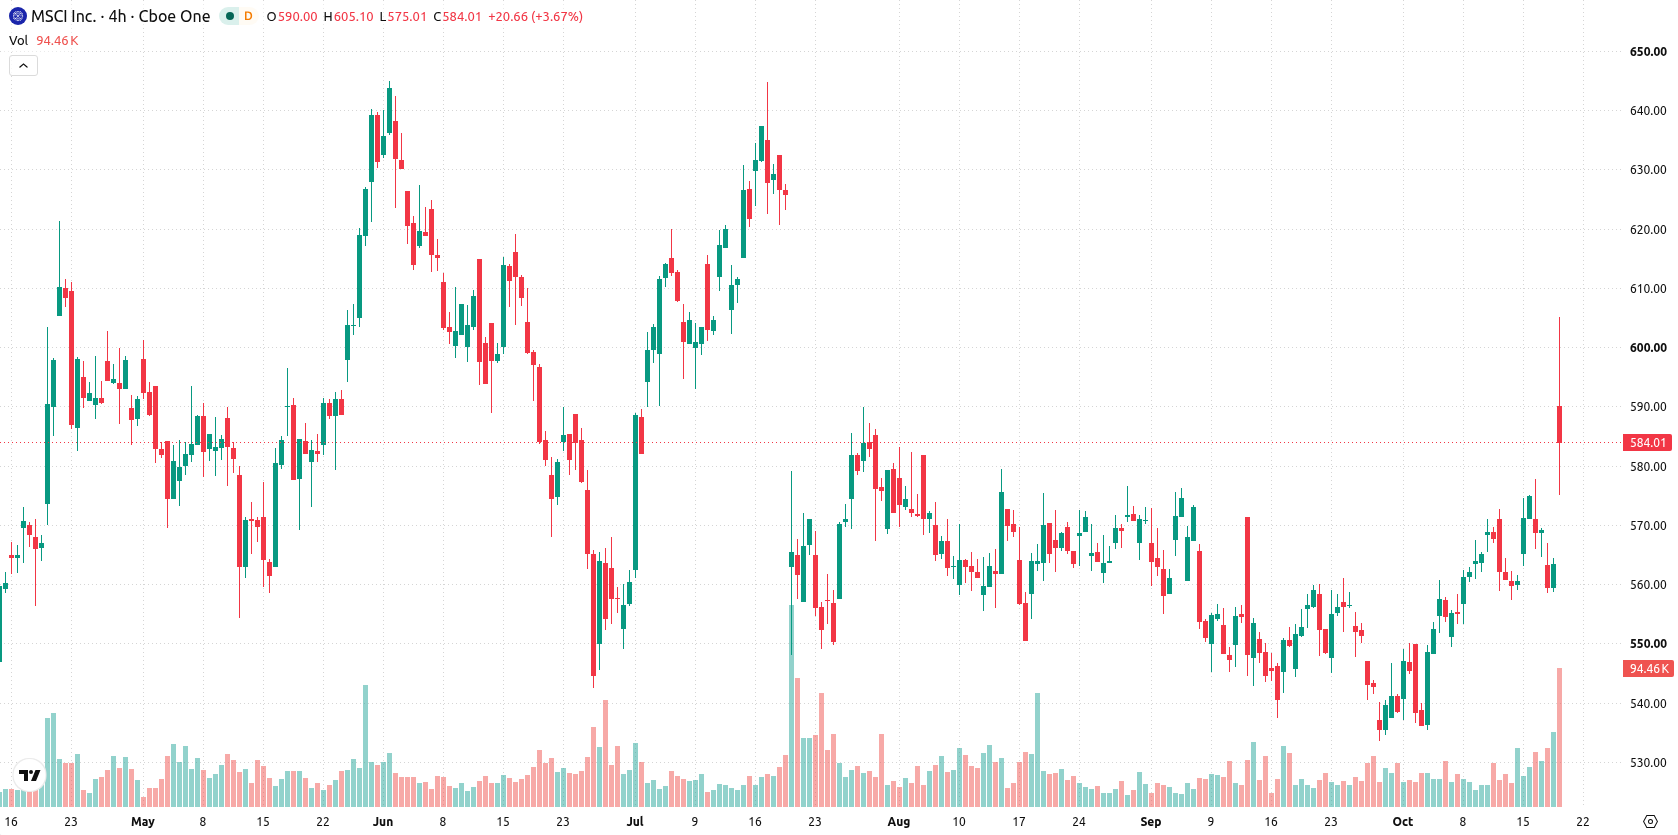
Bullish momentum dominates as support holds and oscillators diverge
MSCI is trading above its 20-day, 50-day, and 200-day moving averages ($555.07, $558.71, $572.18), confirming bullish short-, medium-, and long-term positioning. The near-term floor is at $576.61 and the immediate ceiling is at $605.61, with Ichimoku Kijun ($554.14) and other underlying averages reinforcing trend support from below. Momentum signals are positive as the Moving Average Convergence Divergence (MACD) points to further buying activity, though the Average Directional Index (ADX) shows a neutral trend and the Commodity Channel Index (CCI) and Relative Strength Index (RSI) both favor continued upside without strong overbought signals yet. The Bull/Bear Power (BBP) reading of 6.05 confirms buyers dominate intraday momentum and highlights mild overbought conditions. MSCI is up $21.78 or 3.87% today, following a pronounced upside gap (about 4.2%) and trading mid-range of the daily band, with intraday volatility standing at 5.41%. The intraday tone signals strength after the open, with some consolidation around current levels. There is divergence among oscillators, as Stochastic RSI and the Awesome Oscillator suggest more neutral conditions compared to the bullish tilt in most momentum indicators.
Previously it was reported that MSCI planned to tighten its index eligibility methodology for companies with large non-operating asset holdings, potentially impacting firms with significant digital asset treasuries. The current strong earnings momentum and technical resilience shift the focus toward MSCI’s core business performance, with the key level now $576.61 as immediate trend support to monitor for potential downside risk.











-
 Afghanistan
-
 Albania
-
 Algeria
-
 Angola
-
 Argentina
-
 Armenia
-
 Australia
-
 Austria
-
 Azerbaijan
-
 Bahamas
-
 Bahrain
-
 Bangladesh
-
 Belarus
-
 Belgium
-
 Bolivia
-
 Botswana
-
 Brazil
-
 Brunei
-
 Bulgaria
-
 Cambodia
-
 Cameroon
-
 Canada
-
 Chile
-
 China
-
 Colombia
-
 Congo
-
 Costa Rica
-
 Cote d'Ivoire
-
 Croatia
-
 Cuba
-
 Cyprus
-
 Czechia
-
 DR Congo
-
 Denmark
-
 Dominican Republic
-
 Ecuador
-
 Egypt
-
 El Salvador
-
 Estonia
-
 Eswatini
-
 Ethiopia
-
 Finland
-
 France
-
 Georgia
-
 Germany
-
 Ghana
-
 Greece
-
 Haiti
-
 Hong Kong
-
 Hungary
-
 India
-
 Indonesia
-
 Iran, Islamic republic
-
 Iraq
-
 Ireland
-
 Israel
-
 Italy
-
 Jamaica
-
 Japan
-
 Jordan
-
 Kazakhstan
-
 Kenya
-
 Korea
-
 Kuwait
-
 Kyrgyzstan
-
 Laos
-
 Latvia
-
 Lebanon
-
 Lesotho
-
 Libya
-
 Lithuania
-
 Luxembourg
-
 Madagascar
-
 Malaysia
-
 Malta
-
 Mauritius
-
 Mexico
-
 Moldova
-
 Mongolia
-
 Montenegro
-
 Morocco
-
 Mozambique
-
 Myanmar
-
 Namibia
-
 Nepal
-
 Netherlands
-
 New Zealand
-
 Nigeria
-
 North Macedonia
-
 Norway
-
 Oman
-
 Pakistan
-
 Palestine
-
 Panama
-
 Papua New Guinea
-
 Paraguay
-
 Peru
-
 Philippines
-
 Poland
-
 Portugal
-
 Puerto Rico
-
 Qatar
-
 Reunion
-
 Romania
-
 Rwanda
-
 Saudi Arabia
-
 Serbia
-
 Singapore
-
 Slovakia
-
 Slovenia
-
 Somalia
-
 South Africa
-
 Spain
-
 Sri Lanka
-
 Sweden
-
 Switzerland
-
 Syria
-
 Taiwan
-
 Tajikistan
-
 Tanzania
-
 Thailand
-
 Trinidad and Tobago
-
 Tunisia
-
 Turkey
-
 UAE
-
 Uganda
-
 Ukraine
-
 United Kingdom
-
United States
-
 Uruguay
-
 Uzbekistan
-
 Venezuela
-
 Vietnam
-
 Yemen
-
 Zambia
-
 Zimbabwe
- Forex
- Crypto












