

Goldman Sachs stock weekly forecast: RSI nears oversold with rebound odds limited by resistance

Shares of Goldman Sachs Group, Inc. (GS) are trading near $885 as a modest push higher leaves the stock stretching into oversold territory. Despite the quiet weekly move, the setup remains pressured by persistent selling, and traders will be watching whether key support can hold in the days ahead.
 920.47
932.40
Highlights
- Shares of Goldman Sachs are trading at $884.98, remaining below key moving averages and showing a bearish structural bias.
- Short-term momentum signals approach oversold territory, but the broader trend direction remains firmly downward.
- Price action is expected to remain between $859.72 support and $898.96 resistance, with a high probability of further downside.
Earnings surge and NEOS acquisition lift optimism as revenue beats expectations
Goldman Sachs reported third quarter 2026 results with net income rising to $5.29 billion and total revenue reaching $18.7 billion, driven by a sharp increase in equities trading and record advisory revenues, according to Yahoo Finance. The quarter also saw assets under supervision hit $4.1 trillion, paired with $3 billion in share repurchases and a $5 per share quarterly dividend (source: Yahoo Finance). Goldman Sachs further announced the acquisition of NEOS Investments, a $30 billion ETF business, for up to $2.25 billion, a move intended to bolster its asset management segment as reported by The Motley Fool.
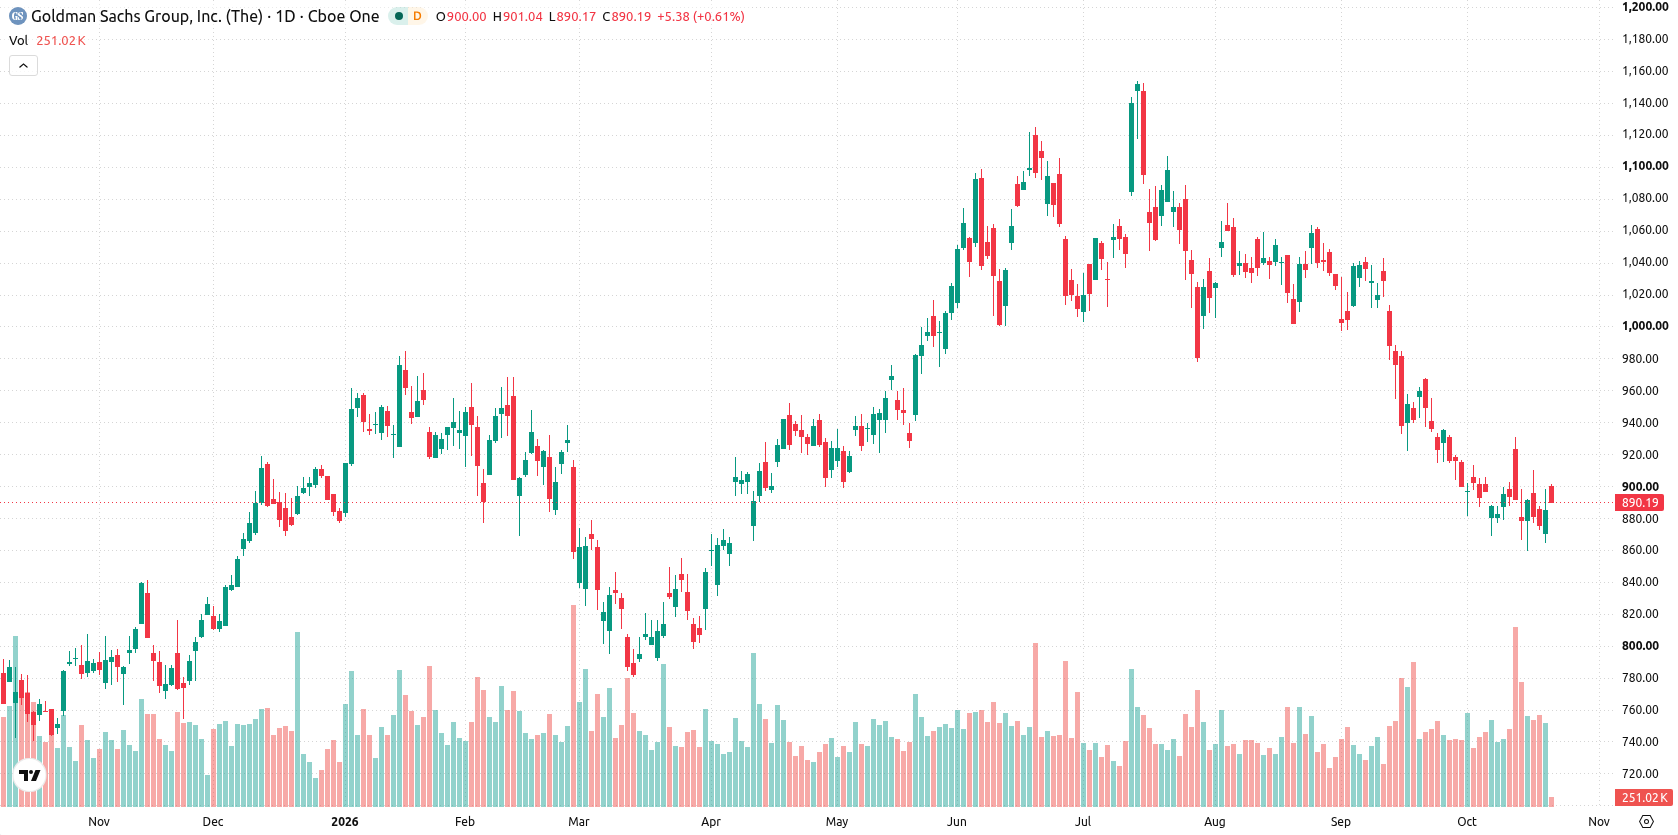
Downtrend persists as MACD and ADX confirm selling despite range-bound volatility
The daily chart shows a trending structure with a sustained move higher but within a generally firm downtrend. MACD and ADX both indicate selling pressure, while the RSI at 37.59 is approaching oversold, highlighting a divergence between short-term momentum and overall trend. The nearest support sits at $859.72, with resistance at the 20-day moving average, $898.96, and the Ichimoku Kijun at $921.97. With volatility at 5.54%, the stock remains active within a well-defined range, leaving room for downside pressure unless a convincing move above resistance emerges.
Downside risk dominates as breakout above resistance remains unlikely next week
For the coming trading week, the expected range is $859.48 to $906.28. There is a very low probability of an increase and a very high probability of a decrease. The base case scenario projects price action contained between support at $859.72 and resistance at $898.96. A sustained break above $898.96 would open the door to a test of $921.97, while a drop below $859.72 would suggest further downside toward the lower end of the forecasted range.
Earlier, analysts noted that Goldman Sachs shares were under persistent selling pressure despite favorable quarterly earnings, with the broader trend remaining bearish. The current analysis confirms ongoing technical weakness, and traders should monitor whether support near $859.72 can hold as the stock tests the lower end of its projected range.






Latest Goldman Sachs News




-
 Afghanistan
-
 Albania
-
 Algeria
-
 Angola
-
 Argentina
-
 Armenia
-
 Australia
-
 Austria
-
 Azerbaijan
-
 Bahamas
-
 Bahrain
-
 Bangladesh
-
 Belarus
-
 Belgium
-
 Bolivia
-
 Botswana
-
 Brazil
-
 Brunei
-
 Bulgaria
-
 Cambodia
-
 Cameroon
-
 Canada
-
 Chile
-
 China
-
 Colombia
-
 Congo
-
 Costa Rica
-
 Cote d'Ivoire
-
 Croatia
-
 Cuba
-
 Cyprus
-
 Czechia
-
 DR Congo
-
 Denmark
-
 Dominican Republic
-
 Ecuador
-
 Egypt
-
 El Salvador
-
 Estonia
-
 Eswatini
-
 Ethiopia
-
 Finland
-
 France
-
 Georgia
-
 Germany
-
 Ghana
-
 Greece
-
 Haiti
-
 Hong Kong
-
 Hungary
-
 India
-
 Indonesia
-
 Iran, Islamic republic
-
 Iraq
-
 Ireland
-
 Israel
-
 Italy
-
 Jamaica
-
 Japan
-
 Jordan
-
 Kazakhstan
-
 Kenya
-
 Korea
-
 Kuwait
-
 Kyrgyzstan
-
 Laos
-
 Latvia
-
 Lebanon
-
 Lesotho
-
 Libya
-
 Lithuania
-
 Luxembourg
-
 Madagascar
-
 Malaysia
-
 Malta
-
 Mauritius
-
 Mexico
-
 Moldova
-
 Mongolia
-
 Montenegro
-
 Morocco
-
 Mozambique
-
 Myanmar
-
 Namibia
-
 Nepal
-
 Netherlands
-
 New Zealand
-
 Nigeria
-
 North Macedonia
-
 Norway
-
 Oman
-
 Pakistan
-
 Palestine
-
 Panama
-
 Papua New Guinea
-
 Paraguay
-
 Peru
-
 Philippines
-
 Poland
-
 Portugal
-
 Puerto Rico
-
 Qatar
-
 Reunion
-
 Romania
-
 Rwanda
-
 Saudi Arabia
-
 Serbia
-
 Singapore
-
 Slovakia
-
 Slovenia
-
 Somalia
-
 South Africa
-
 Spain
-
 Sri Lanka
-
 Sweden
-
 Switzerland
-
 Syria
-
 Taiwan
-
 Tajikistan
-
 Tanzania
-
 Thailand
-
 Trinidad and Tobago
-
 Tunisia
-
 Turkey
-
 UAE
-
 Uganda
-
 Ukraine
-
 United Kingdom
-
United States
-
 Uruguay
-
 Uzbekistan
-
 Venezuela
-
 Vietnam
-
 Yemen
-
 Zambia
-
 Zimbabwe
- Forex
- Crypto












